giCentre, City, University of London #1017
Jo Wood
View presentation:2022-10-16T14:55:00ZGMT-0600Change your timezone on the schedule page
2022-10-16T14:55:00Z

The live footage of the talk, including the Q&A, can be viewed on the session page, VAST Challenge: Opening, Challenge 1, and Start of Challenge 2.
Abstract
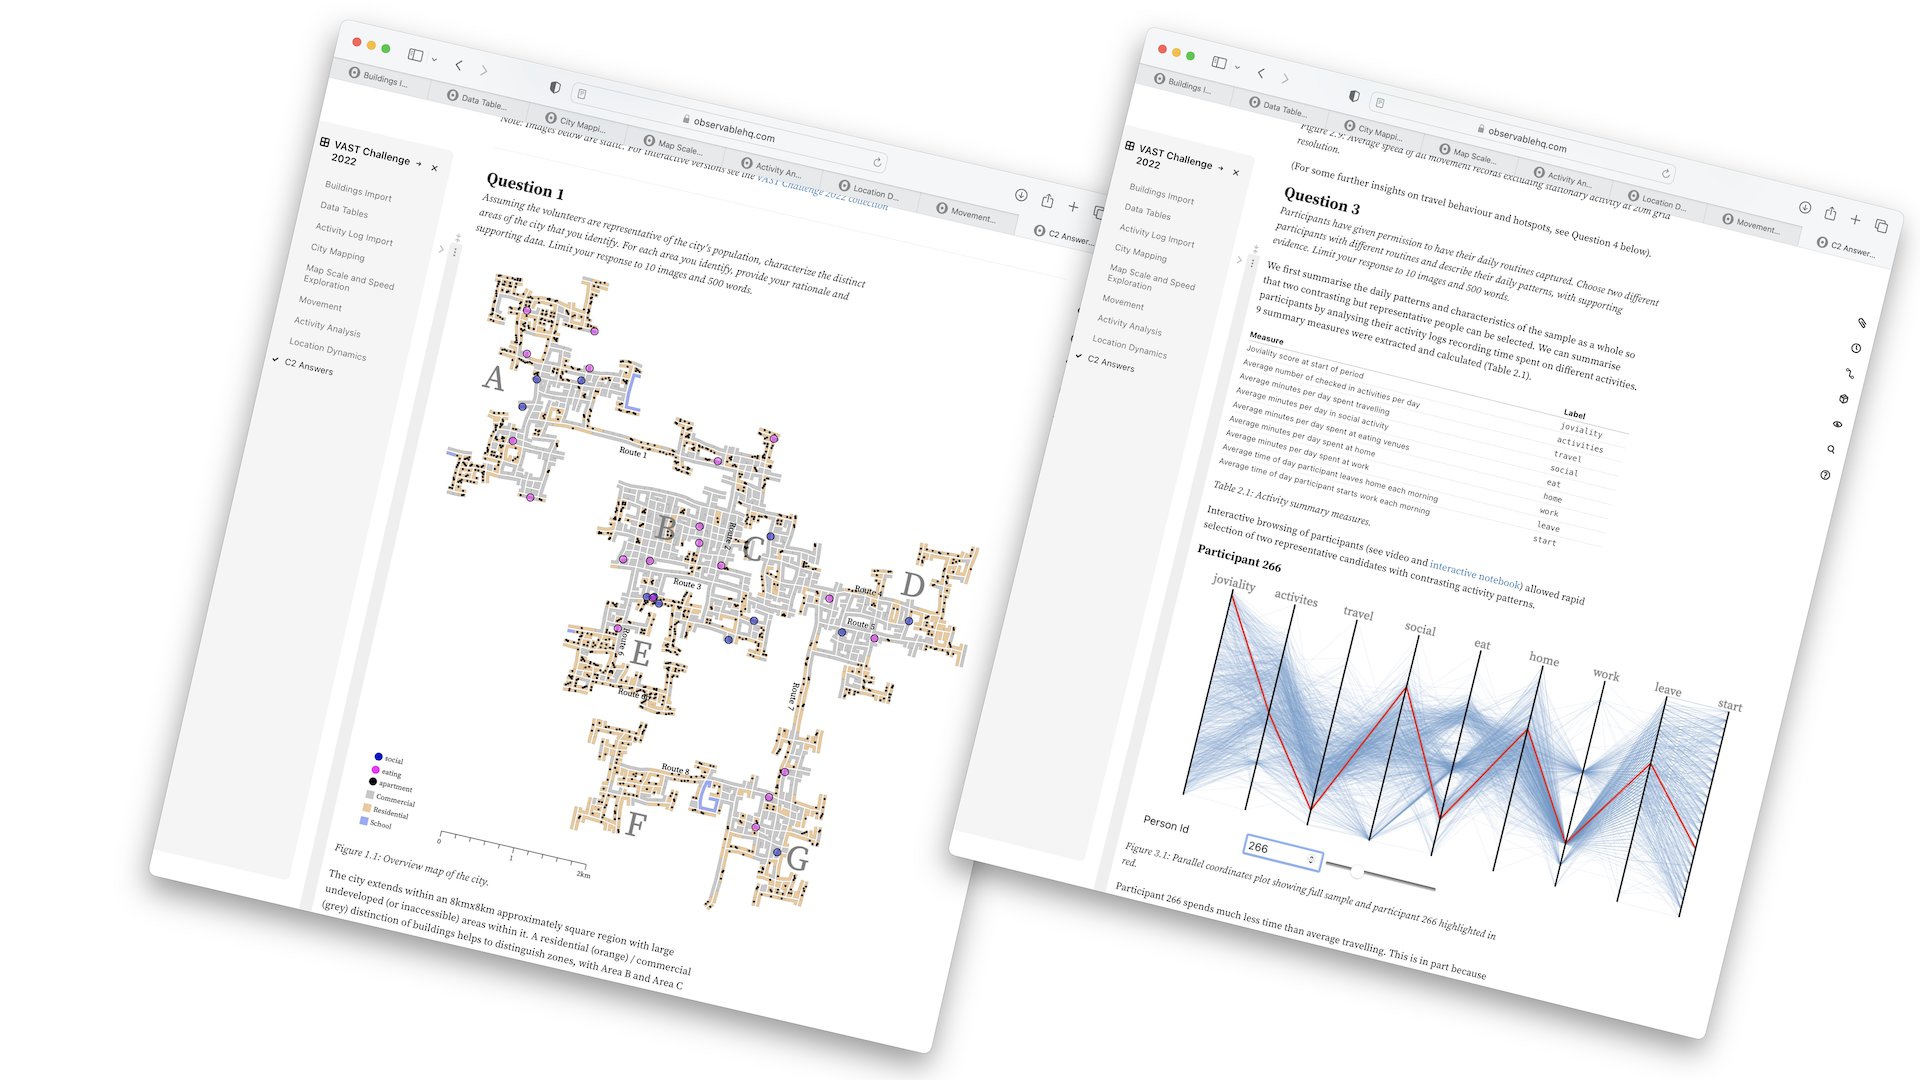
The VAST 2022 Challenge 1 put us in place of an urban planning analyst for the fictitious city Engagement, Ohio. Given a large, interlinked dataset of its citizens, businesses and activities, we were tasked to assemble a summary of the state of Engagement to serve as basis for future investments. We present a visual analytics application to interactively explore this complex dataset using a combination of dashboards and a 2D/3D map. Our application uses interactive visualizations to iteratively build and analyze subgroups, sync their abstract data with spatial positions, and detect clusters and patterns in the data.