Paper 6: Interactive Visualization for Data Science Scripts

Rebecca Faust, Carlos Scheidegger, Katherine Isaacs, William Bernstein, Michael Sharp, Chris North

View presentation:2022-10-16T16:03:00ZGMT-0600Change your timezone on the schedule page
2022-10-16T16:03:00Z
Exemplar figure, described by caption below
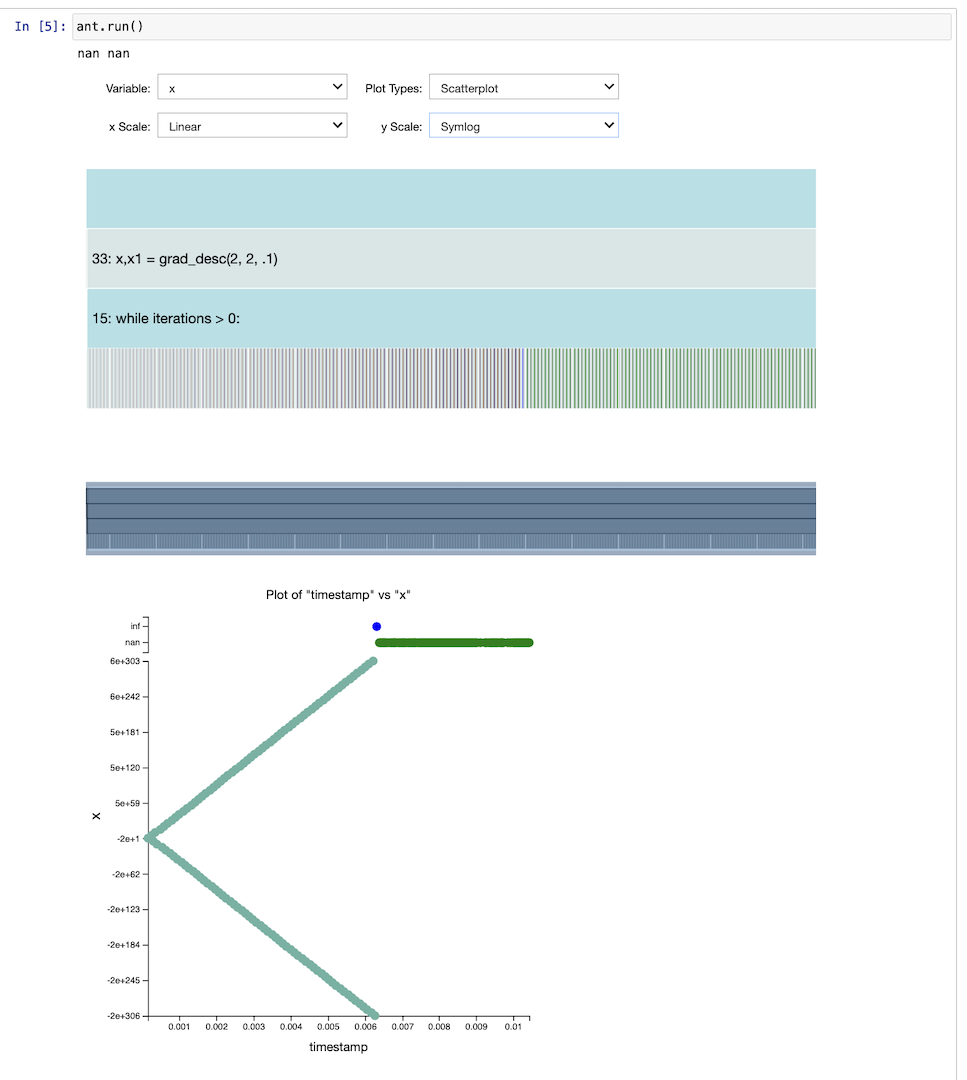
An example of the interactive visualizations provided by our debugging method, Anteater. Anteater traces data science scripts and computational notebooks as they execute and automatically generates interactive visualizations to enable exploration of execution data. It provides a plot of the execution hierarchy as well as plots of variable values with linking interactions. Anteater quickly illustrates the progression of execution values and enables insight into the behavior of the analysis.

The live footage of the talk, including the Q&A, can be viewed on the session page, VDS: Paper Session 2 + Keynote 2.

Abstract