SkyGlyphs: Reflections on the Design of a Delightful Visualization
Bon Adriel Aseniero, Sheelagh Carpendale, George Fitzmaurice, Justin Matejka
View presentation:2022-10-20T14:24:00ZGMT-0600Change your timezone on the schedule page
2022-10-20T14:24:00Z
The live footage of the talk, including the Q&A, can be viewed on the session page, VISAP: Papers 2.
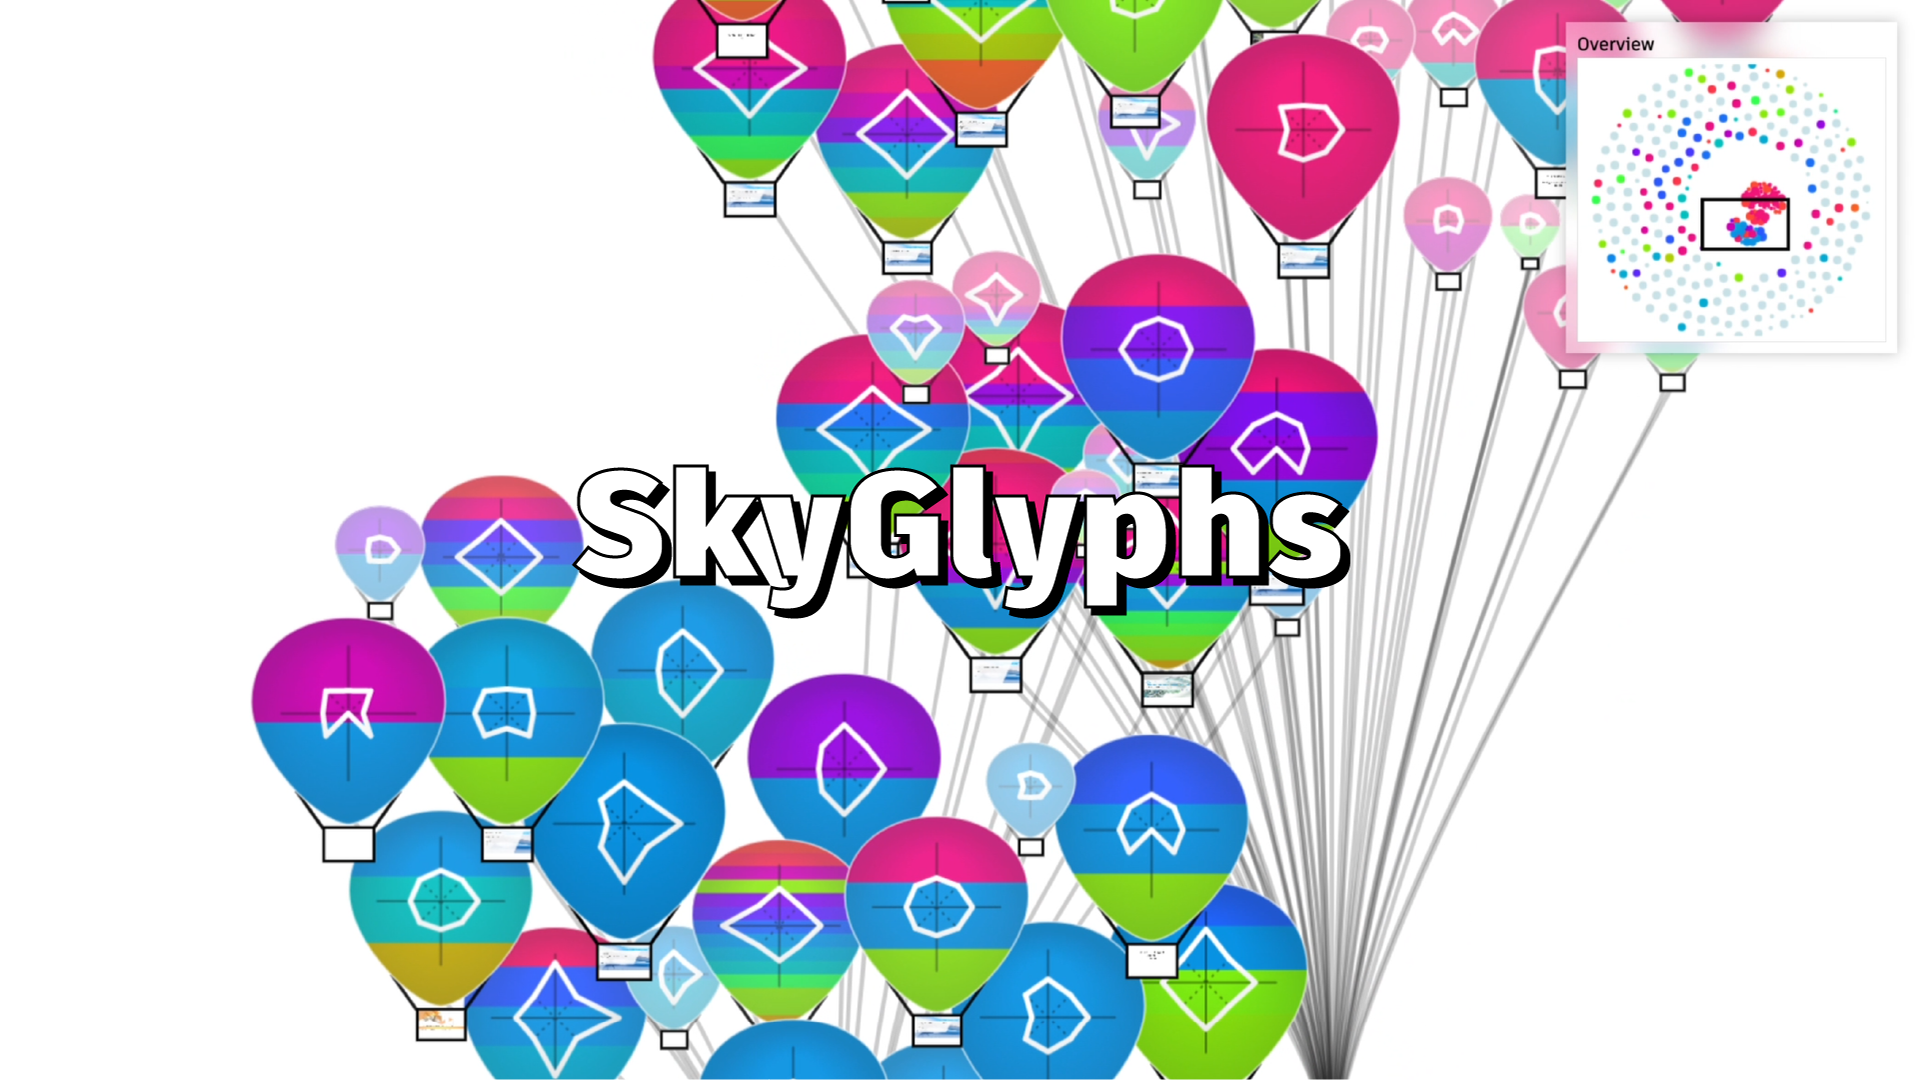
Abstract
In creating SkyGlyphs, our goal was to develop a data visualization that could possibly capture people’s attention and spark their curiosity to explore a dataset. This work was inspired by a mingling of research including serendipitous interactions, visualizations for public displays, and personal visualizations. SkyGlyphs is a nonconventional whimsical visualization, depicting datapoints as animated balloons in space. We designed it to encourage non-experts to casually browse the contents of a repository through visual interactions like linking and grouping of datapoints. Our contributions include SkyGlyphs’ representation and our design reflection that reveals a perspective on how to design delightful visualizations.