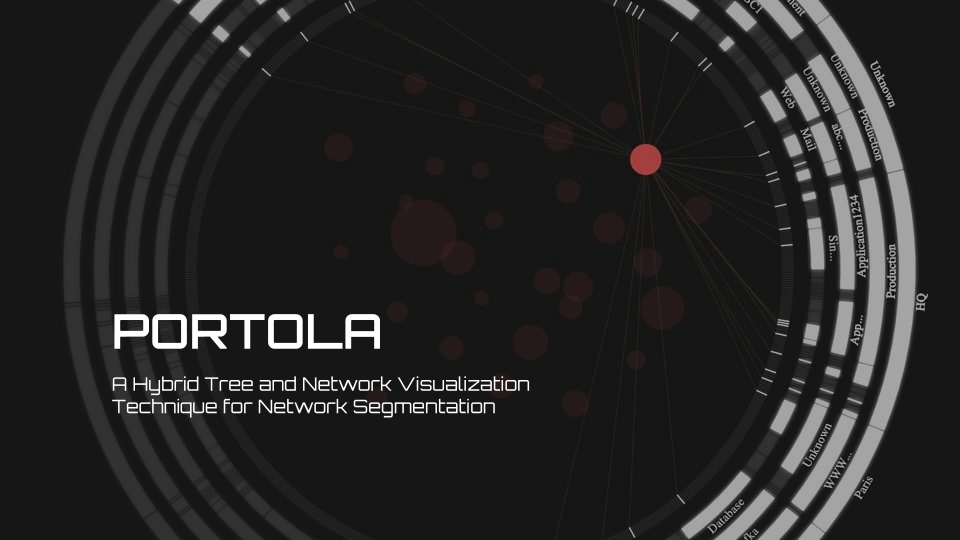
Portola: A Hybrid Tree and Network Visualization Technique for Network Segmentation #7865
Kuhu Gupta, Aditeya Pandey, Larry Chan, Ambika Yadav, Brian Staats, Michelle Borkin
View presentation:2022-10-19T16:20:00ZGMT-0600Change your timezone on the schedule page
2022-10-19T16:20:00Z

The live footage of the talk, including the Q&A, can be viewed on the session page, VizSec: Best Paper Announcement and Papers.
Keywords
Visualization—Cybersecurity—Analysis—Survey—VizSec
Abstract
In this paper, we present research on the analysis of the design space for cybersecurity visualizations in VizSec. At the beginning of this research, we analyzed 17 survey papers in the field of cybersecurity visualization. Based on the analysis of the focus areas in each of these survey papers, we identified five key components of visual- ization design, i.e. Input Data, Security Tasks, Visual Encoding, Interactivity, and Evaluation. To show how research papers align with these components, we analyzed 60 papers published at the IEEE Symposium on Visualization for Cyber Security (VizSec) be- tween 2016 and 2021 in the context of the five identified components. As a result, each research paper was classified into several categories derived from the selected components of the visualization design. Our contributions are: (i) an analysis of the focus areas in survey papers on cybersecurity visualization and (ii) the classification of 60 research papers in the context of the selected components of the visualization design. Finally, we highlighted the main findings of the analysis and drew conclusions.