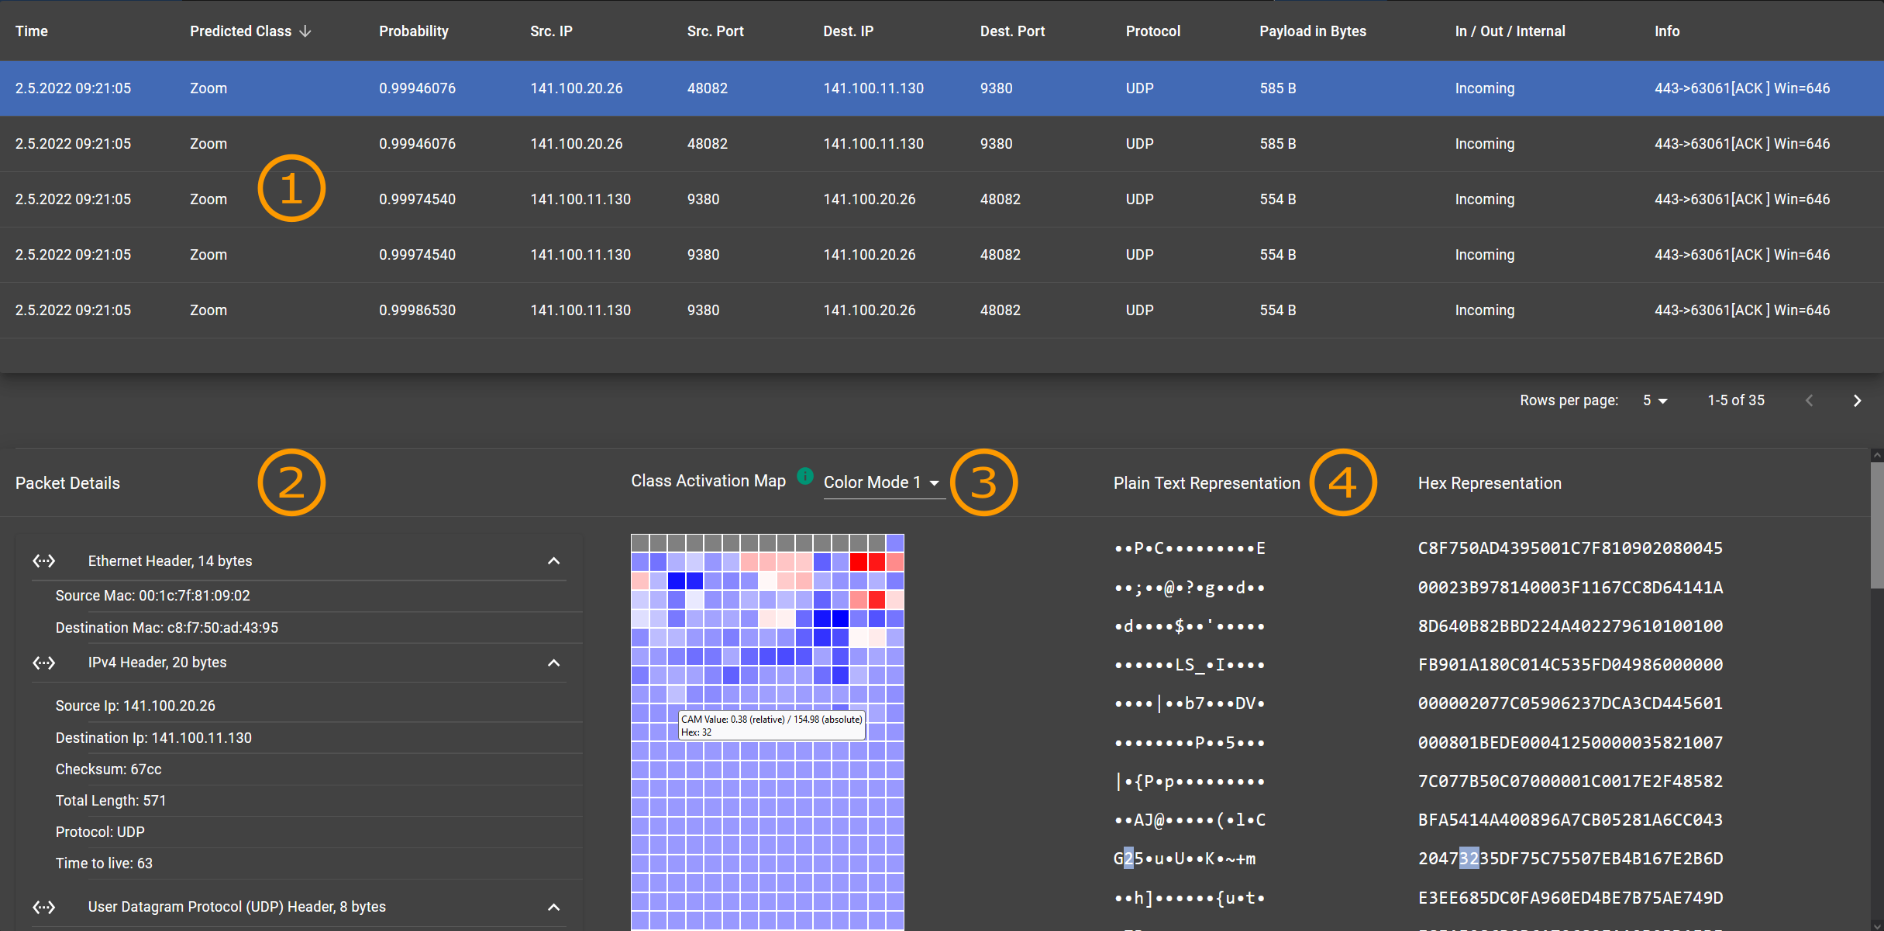
Visualization Of Class Activation Maps To Explain AI Classification Of Network Packet Captures #7912
Igor Cherepanov, Alex Ulmer, Jonathan Geraldi Joewono, Jörn Kohlhammer
View presentation:2022-10-19T16:05:00ZGMT-0600Change your timezone on the schedule page
2022-10-19T16:05:00Z
The live footage of the talk, including the Q&A, can be viewed on the session page, VizSec: Best Paper Announcement and Papers.
Keywords
Human-centered computing, Visualization, User interface design, Interpretability, Network Classification, Convolutional Neural Networks
Abstract
The classification of internet traffic has become increasingly important due to the rapid growth of today’s networks and application variety. The number of connections and the addition of new applications in our networks causes a vast amount of log data and complicates the search for common patterns by experts. Finding such patterns among specific classes of applications is necessary to fulfill various requirements in network analytics. Supervised deep learning methods learn features from raw data and achieve high accuracy in classification. However, these methods are very complex and are used as black-box models, which weakens the experts’ trust in these classifications. Moreover, by using them as a black-box, new knowledge cannot be obtained from the model predictions despite their excellent performance. Therefore, the explainability of the classifications is crucial. Besides increasing trust, the explanation can be used for model evaluation to gain new insights from the data and to improve the model. In this paper, we present a visual and interactive tool that combines the classification of network data with an explanation technique to form an interface between experts, algorithms, and data.