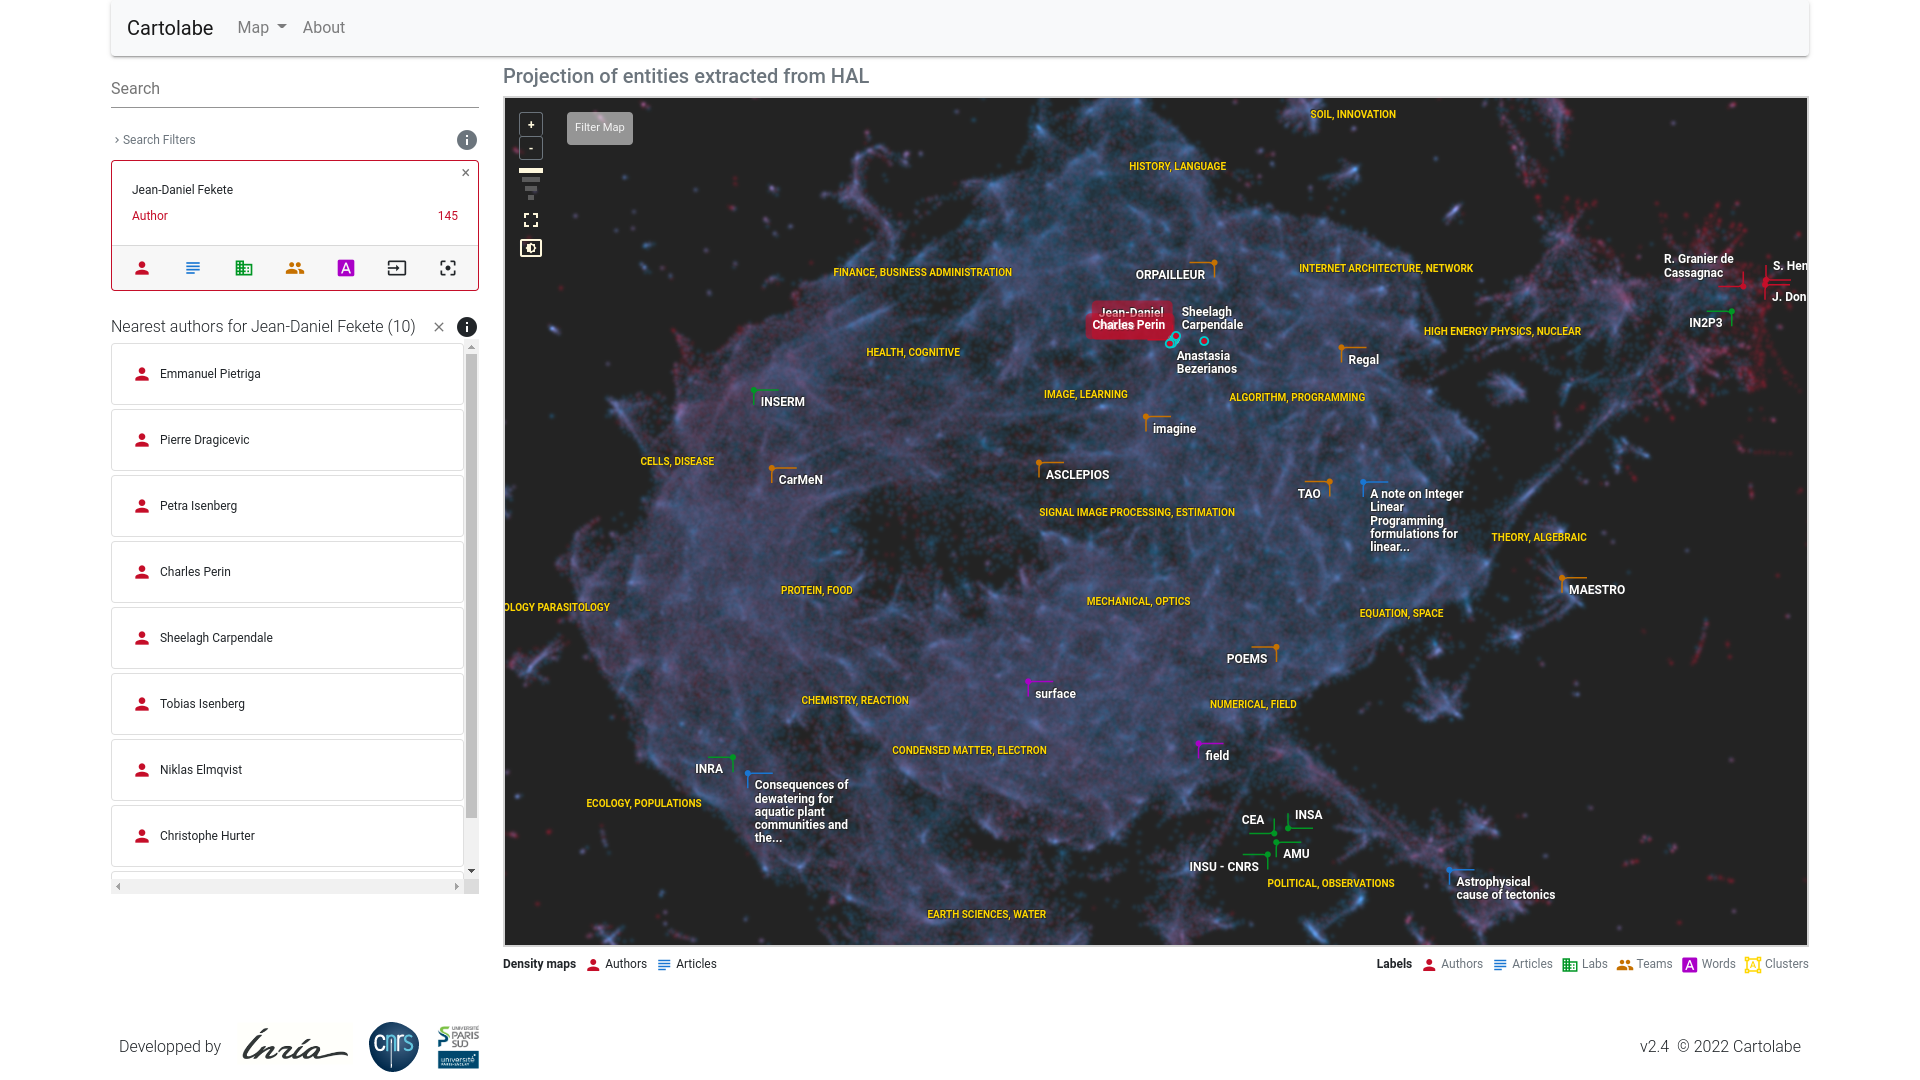
Cartolabe: A Web-Based Scalable Visualization of Large Document Collections

Philippe Caillou, Jonas Renault, Jean-Daniel Fekete, Anne-Catherine Letournel, Michèle Sebag

View presentation:2022-10-20T21:45:00ZGMT-0600Change your timezone on the schedule page
2022-10-20T21:45:00Z
Exemplar figure, described by caption below
Cartolabe visualization of the HAL scientific repository, containing all the French scientific articles (about 1 million) and authors (about 2 millions). Blue points represent articles and red points authors. The layout is computed using the UMAP projection so that close points relate to similar entites whereas distant points are less similar. One author is selected (Jean-Daniel Fekete) and highlighted, along with his 10 nearest neighbors. The visualization is available at https://cartolabe.fr and allow exploring large document collections, such as arXiv, HAL, and wikipedia.

Prerecorded Talk

The live footage of the talk, including the Q&A, can be viewed on the session page, Visualization Teaching and Literacy (cont.) and Machine Learning for Vis..

Fast forward
Abstract