ASTF: Visual Abstractions of Time-Varying Patterns in Radio Signals
Ying Zhao, Luhao Ge, Huixuan Xie, Genghuai Bai, Zhao Zhang, Qiang Wei, Yun Lin, Yuchao Liu, Fangfang Zhou
View presentation:2022-10-19T14:48:00ZGMT-0600Change your timezone on the schedule page
2022-10-19T14:48:00Z
Prerecorded Talk
The live footage of the talk, including the Q&A, can be viewed on the session page, Temporal Data.
Fast forward
Abstract
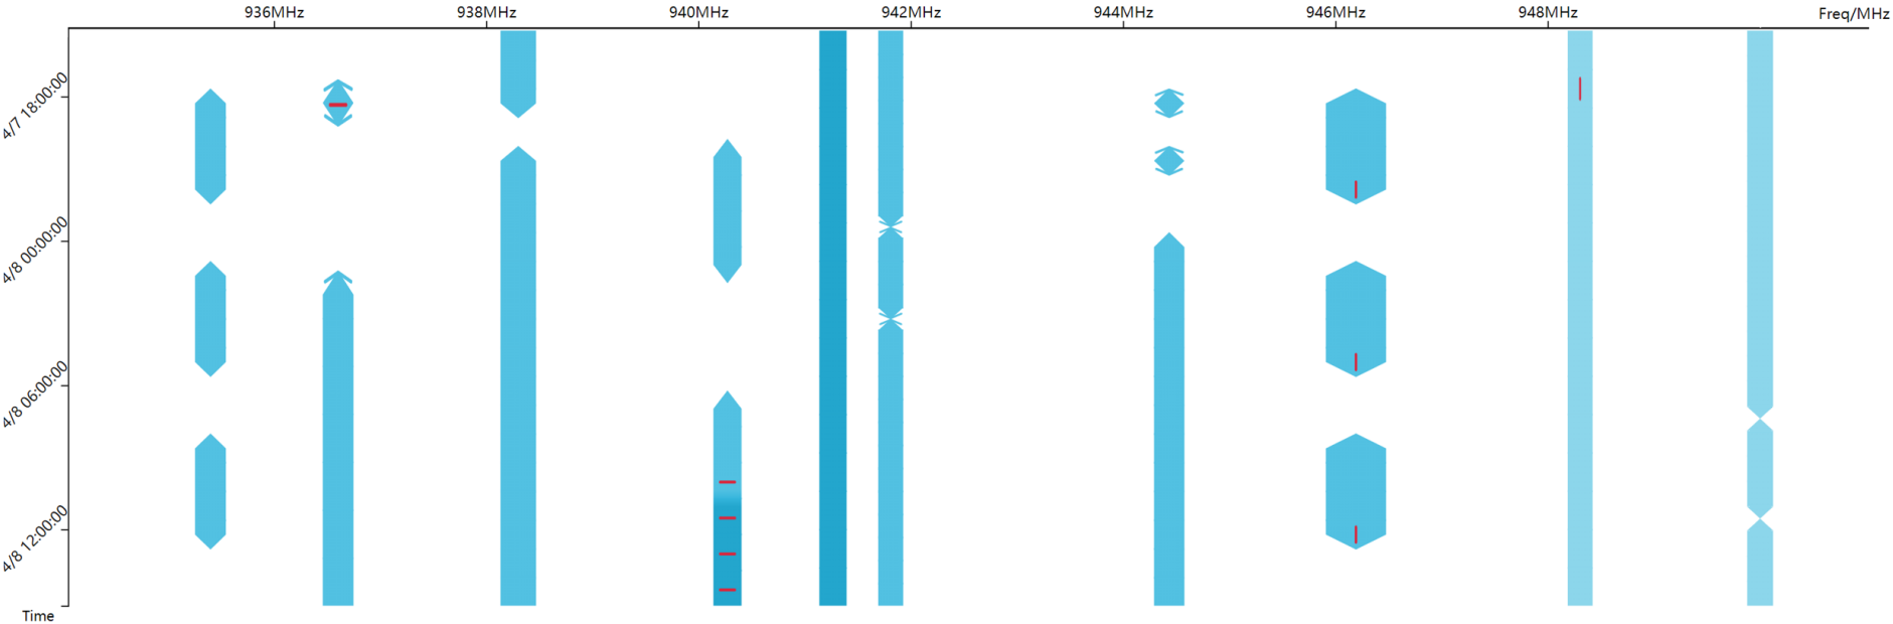
A time-frequency diagram is a commonly used visualization for observing the time-frequency distribution of radio signals and analyzing their time-varying patterns of communication states in radio monitoring and management. While it excels when performing short-term signal analyses, it becomes inadaptable for long-term signal analyses because it cannot adequately depict signal time-varying patterns in a large time span on a space-limited screen. This research thus presents an abstract signal time-frequency (ASTF) diagram to address this problem. In the diagram design, a visual abstraction method is proposed to visually encode signal communication state changes in time slices. A time segmentation algorithm is proposed to divide a large time span into time slices. Three new quantified metrics and a loss function are defined to ensure the preservation of important time-varying information in the time segmentation. An algorithm performance experiment and a user study are conducted to evaluate the effectiveness of the diagram for long-term signal analyses.