Unifying Effects of Direct and Relational Associations for Visual Communication
Melissa A. Schoenlein, Johnny Campos, Kevin Lande, Laurent Lessard, Karen Schloss
View presentation:2022-10-19T16:21:00ZGMT-0600Change your timezone on the schedule page
2022-10-19T16:21:00Z
Prerecorded Talk
The live footage of the talk, including the Q&A, can be viewed on the session page, Understanding and Modeling How People Respond to Visualizations.
Fast forward
Abstract
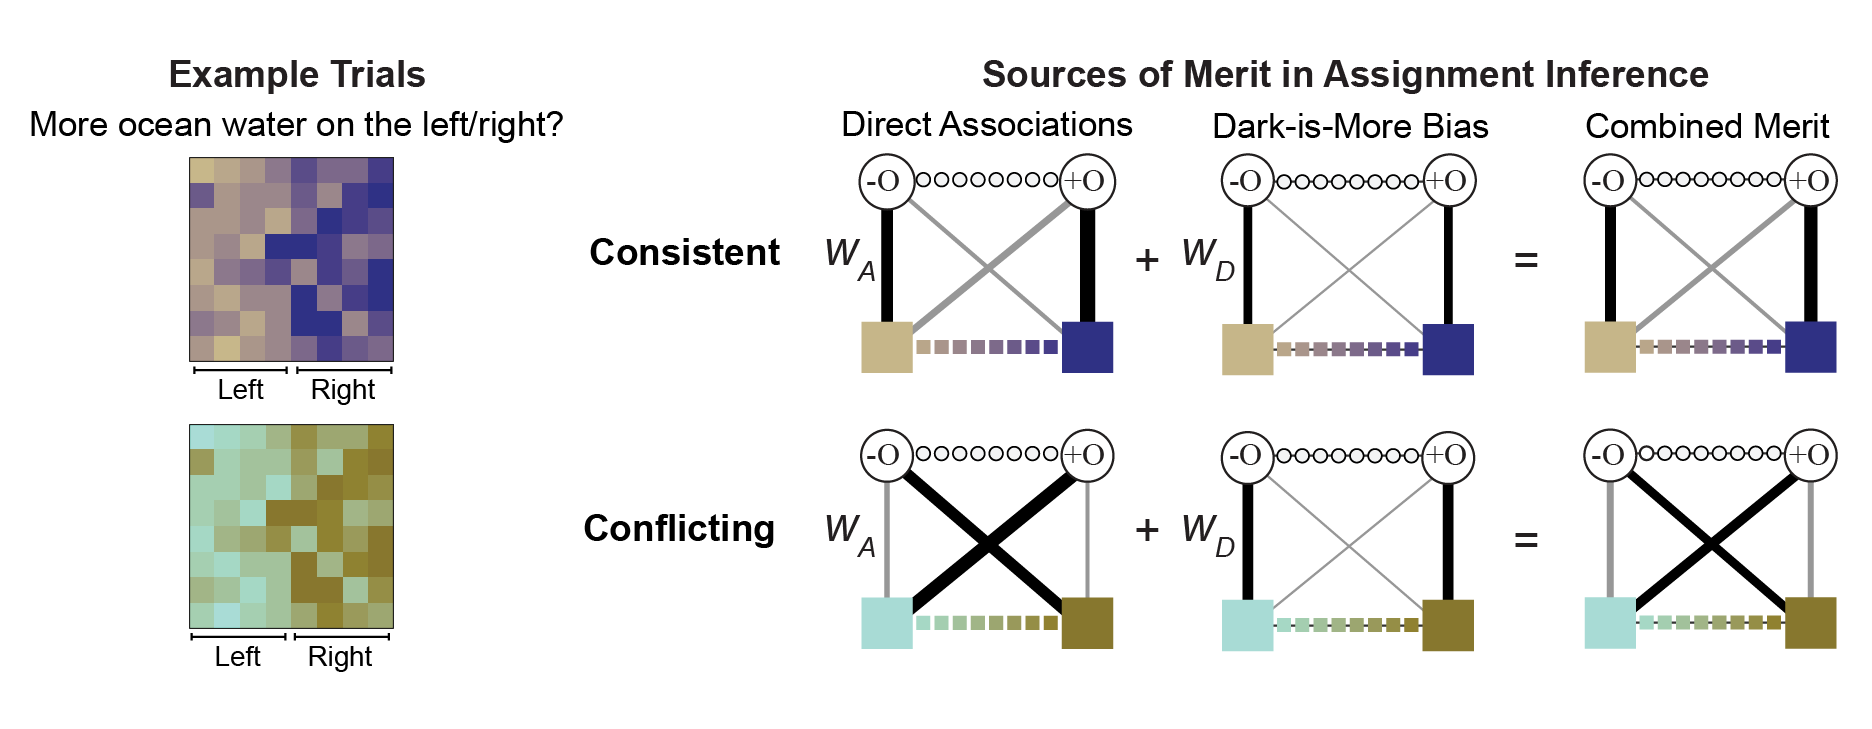
People have expectations about how colors map to concepts in visualizations, and they are better at interpreting visualizations that match their expectations. Traditionally, studies on these expectations (inferred mappings) distinguished distinct factors relevant for visualizations of categorical vs. continuous information. Studies on categorical information focused on direct associations (e.g., mangos are associated with yellows) whereas studies on continuous information focused on relational associations (e.g., darker colors map to larger quantities; dark-is-more bias). We unite these two areas within a single framework of assignment inference. Assignment inference is the process by which people infer mappings between perceptual features and concepts represented in encoding systems. Observers infer globally optimal assignments by maximizing the “merit,” or “goodness,” of each possible assignment. Previous work on assignment inference focused on visualizations of categorical information. We extend this approach to visualizations of continuous data by (a) broadening the notion of merit to include relational associations and (b) developing a method for combining multiple (sometimes conflicting) sources of merit to predict people’s inferred mappings. We developed and tested our model on data from experiments in which participants interpreted colormap data visualizations, representing fictitious data about environmental concepts (sunshine, shade, wild fire, ocean water, glacial ice). We found both direct and relational associations contribute independently to inferred mappings. These results can be used to optimize visualization design to facilitate visual communication.