Understanding Barriers to Network Exploration with Visualization: A Report from the Trenches
Mashael AlKadi, Vanessa Serrano, James Scott-Brown, Uta Hinrichs, Catherine Plaisant, Jean-Daniel Fekete, Benjamin Bach
View presentation:2022-10-20T16:33:00ZGMT-0600Change your timezone on the schedule page
2022-10-20T16:33:00Z
Prerecorded Talk
The live footage of the talk, including the Q&A, can be viewed on the session page, Graphs and Networks.
Fast forward
Abstract
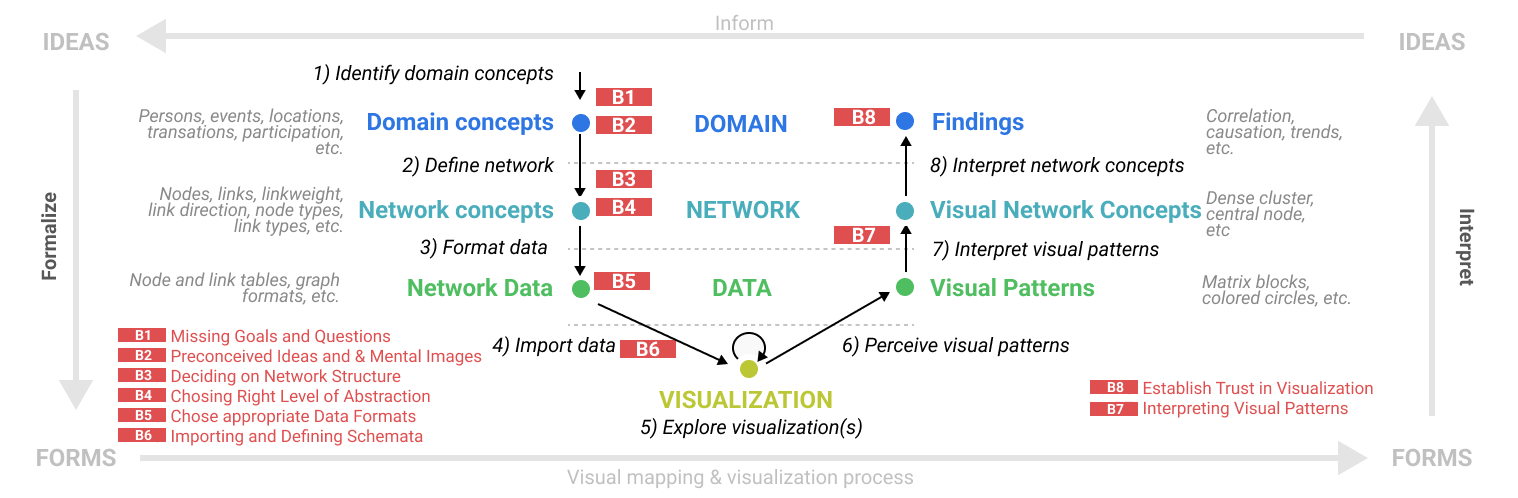
This article reports on an in-depth study that investigates barriers to network exploration with visualizations. Network visualization tools are becoming increasingly popular, but little is known about how analysts plan and engage in the visual exploration of network data—which exploration strategies they employ, and how they prepare their data, define questions, and decide on visual mappings. Our study involved a series of workshops, interaction logging, and observations from a 6-week network exploration course. Our findings shed light on the stages that define analysts’ approaches to network visualization and barriers experienced by some analysts during their network visualization processes. These barriers mainly appear before using a specific tool and include defining exploration goals, identifying relevant network structures and abstractions, or creating appropriate visual mappings for their network data. Our findings inform future work in visualization education and analyst-centered network visualization tool design.