PMU Tracker: A Visualization Platform for Epicentric Event Propagation Analysis in the Power Grid
Anjana Arunkumar, Andrea Pinceti, Lalitha Sankar, Chris Bryan
View presentation:2022-10-20T21:09:00ZGMT-0600Change your timezone on the schedule page
2022-10-20T21:09:00Z
Prerecorded Talk
The live footage of the talk, including the Q&A, can be viewed on the session page, Infrastructure Management.
Fast forward
Abstract
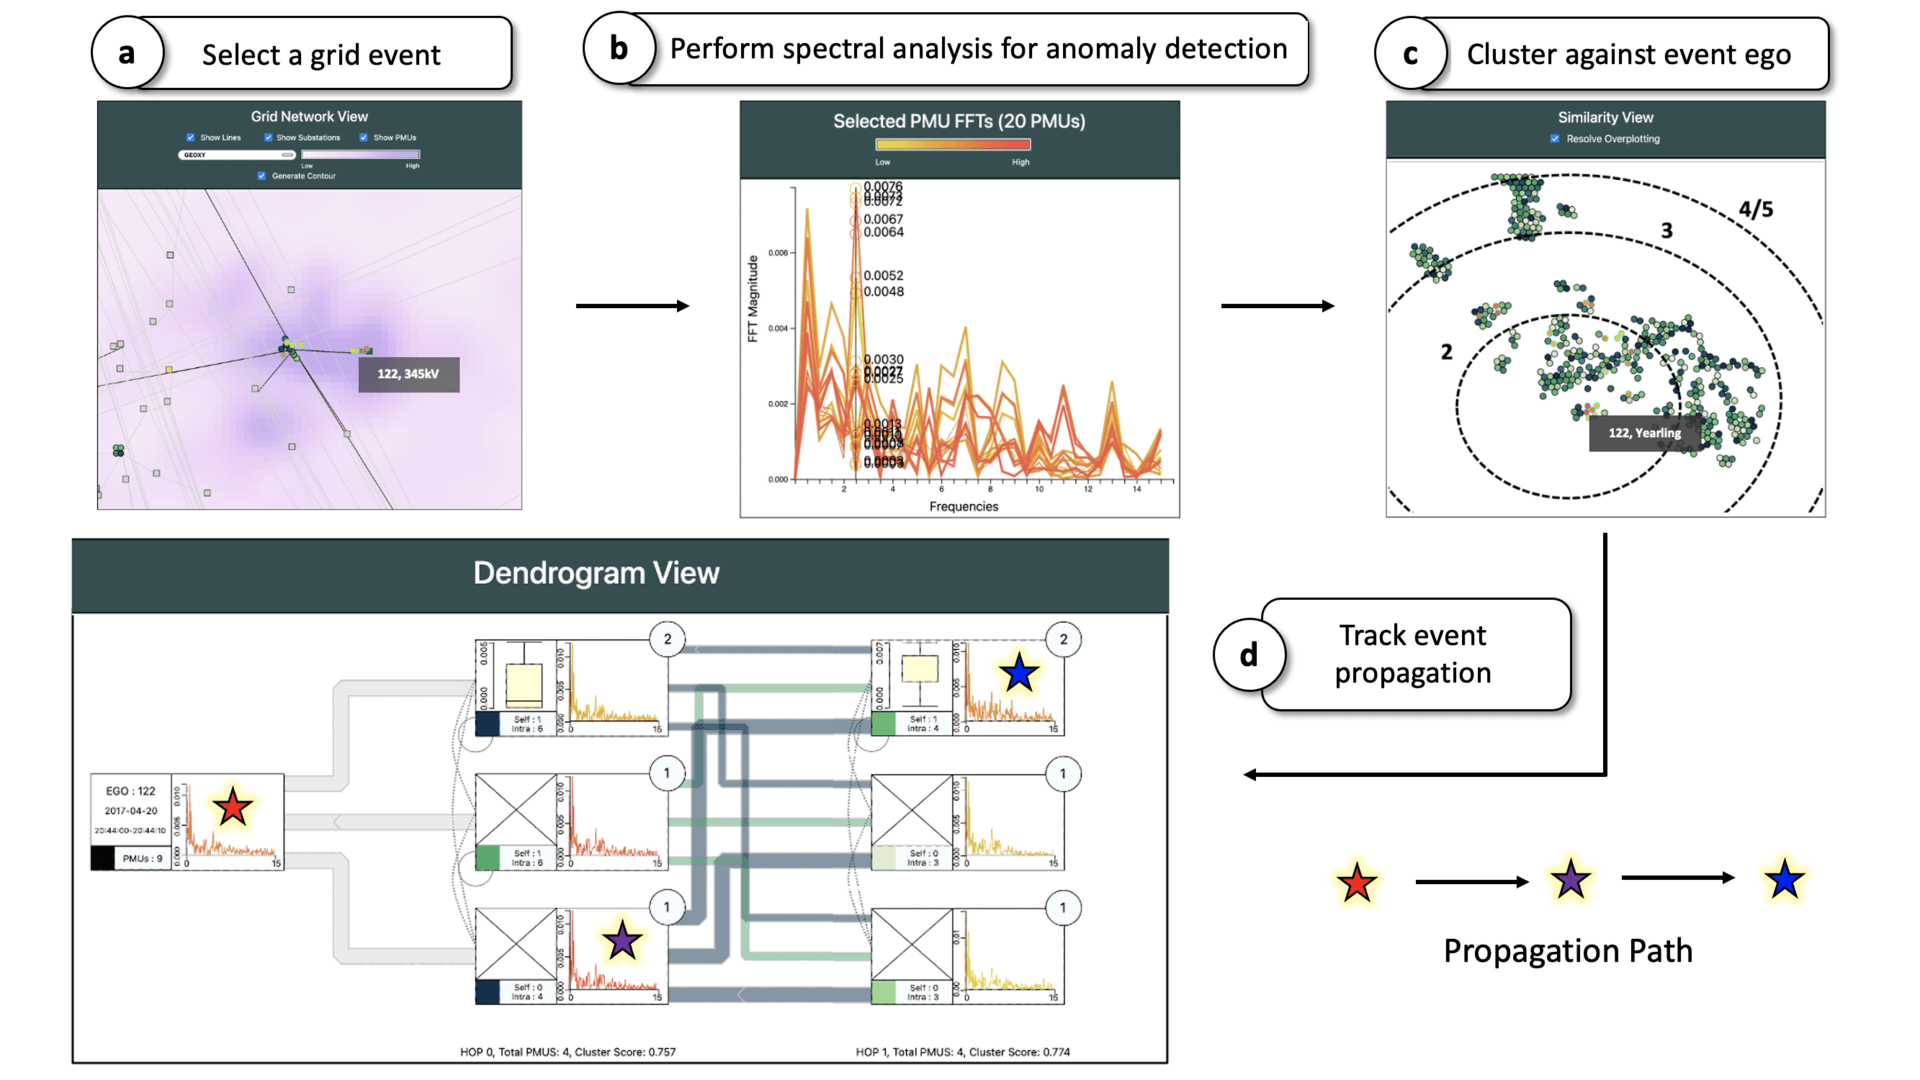
The electrical power grid is a critical infrastructure, with disruptions in transmission having severe repercussions on daily activities, across multiple sectors. To identify, prevent, and mitigate such events, power grids are being refurbished as ‘smart’ systems that include the widespread deployment of GPS-enabled phasor measurement units (PMUs). PMUs provide fast, precise, and time-synchronized measurements of voltage and current, enabling real-time wide-area monitoring and control. However, the potential benefits of PMUs, for analyzing grid events like abnormal power oscillations and load fluctuations, are hindered by the fact that these sensors produce large, concurrent volumes of noisy data. In this paper, we describe working with power grid engineers to investigate how this problem can be addressed from a visual analytics perspective. As a result, we have developed PMU Tracker, an event localization tool that supports power grid operators in visually analyzing and identifying power grid events and tracking their propagation through the power grid’s network. As a part of the PMU Tracker interface, we develop a novel visualization technique which we term an epicentric cluster dendrogram, which allows operators to analyze the effects of an event as it propagates outwards from a source location. We robustly validate PMU Tracker with: (1) a usage scenario demonstrating how PMU Tracker can be used to analyze anomalous grid events, and (2) case studies with power grid operators using a real-world interconnection dataset. Our results indicate that PMU Tracker effectively supports the analysis of power grid events; we also demonstrate and discuss how PMU Tracker’s visual analytics approach can be generalized to other domains composed of time-varying networks with epicentric event characteristics.