A Framework for Multiclass Contour Visualization
Sihang Li, Jiacheng Yu, Mingxuan Li, Le Liu, Xiaolong (Luke) Zhang, Xiaoru Yuan
View presentation:2022-10-19T16:45:00ZGMT-0600Change your timezone on the schedule page
2022-10-19T16:45:00Z
Prerecorded Talk
The live footage of the talk, including the Q&A, can be viewed on the session page, Visualization Design.
Fast forward
Abstract
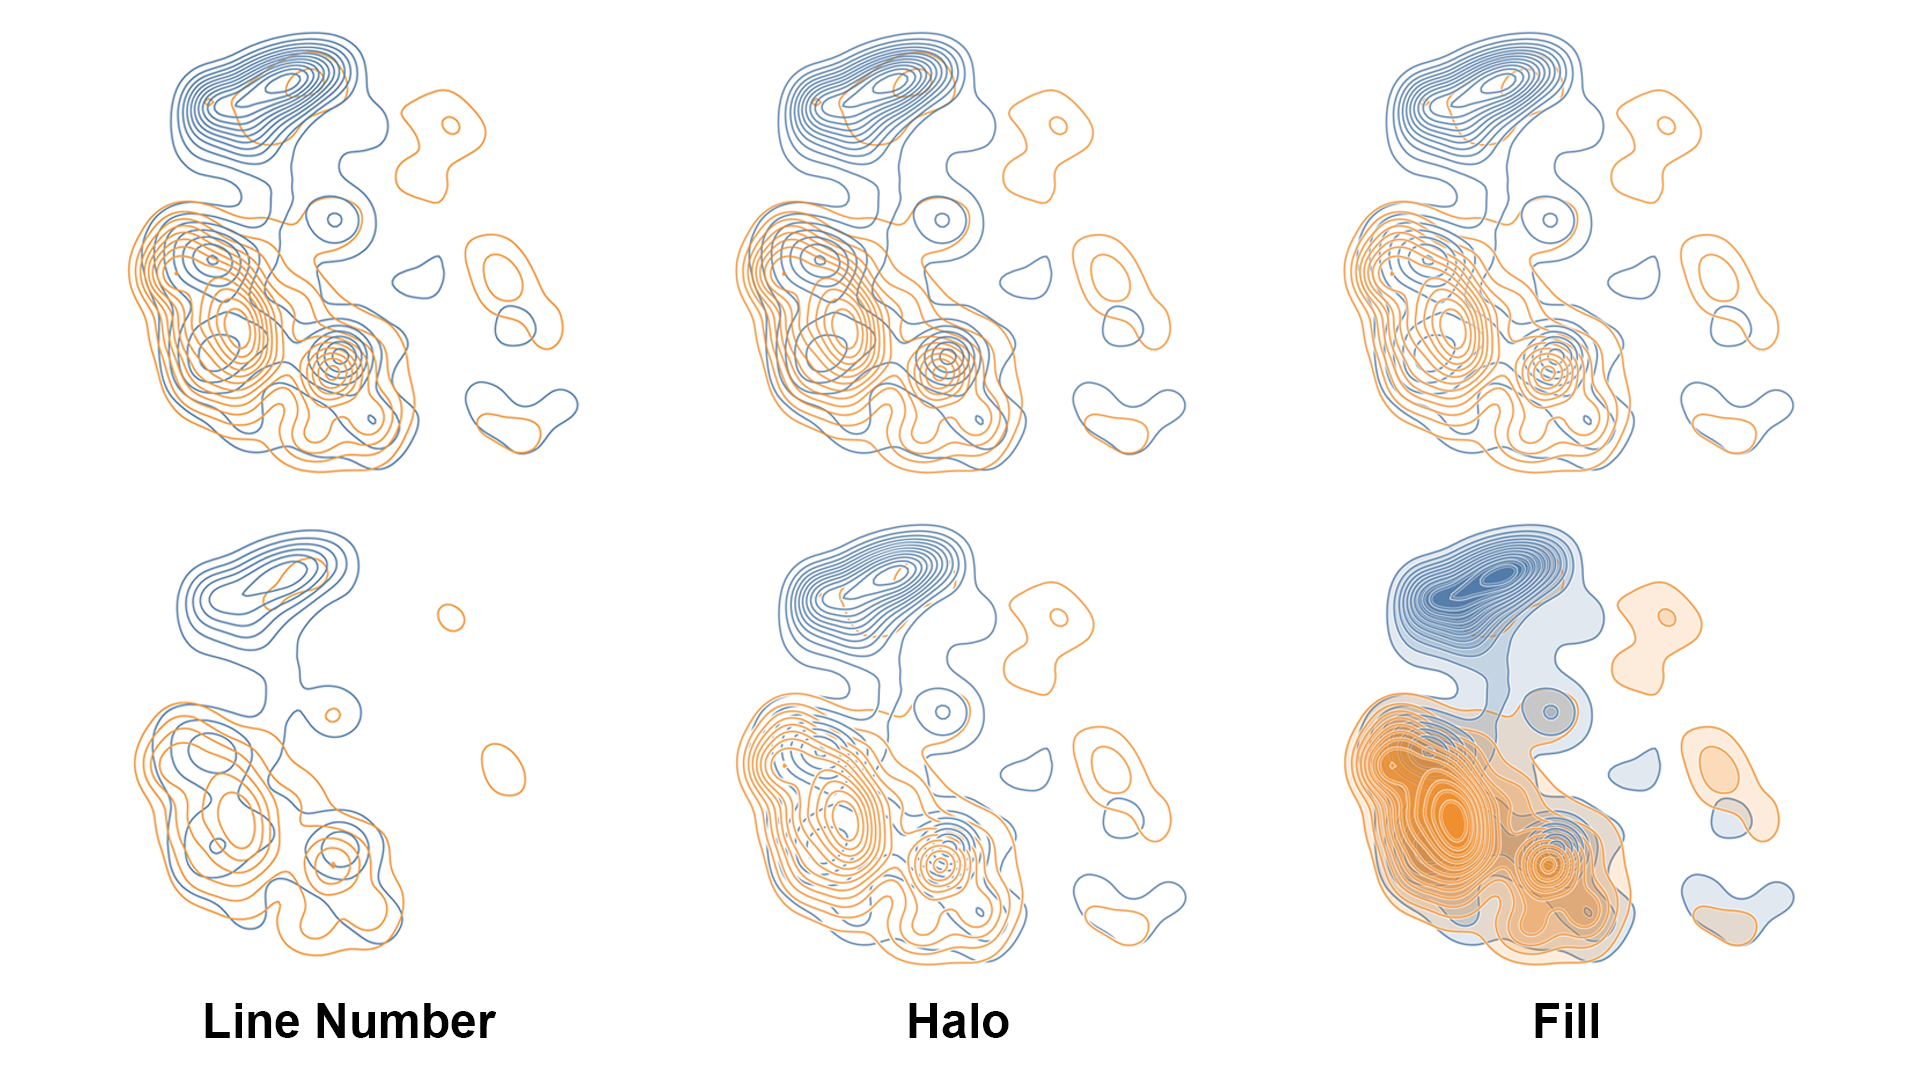
Multiclass contour visualization is often used to interpret complex data attributes in such fields as weather forecasting, computational fluid dynamics, and artificial intelligence. However, effective and accurate representations of underlying data patterns and correlations can be challenging in multiclass contour visualization, primarily due to the inevitable visual cluttering and occlusions when the number of classes is significant. To address this issue, visualization design must carefully choose design parameters to make visualization more comprehensible. With this goal in mind, we proposed a framework for multiclass contour visualization. The framework has two components: a set of four visualization design parameters, which are developed based on an extensive review of literature on contour visualization, and a declarative domain-specific language (DSL) for creating multiclass contour rendering, which enables a fast exploration of those design parameters. A task-oriented user study was conducted to assess how those design parameters affect users' interpretations of real-world data. The study results offered some suggestions on the value choices of design parameters in multiclass contour visualization.