Photosensitive Accessibility for Interactive Data Visualizations
Laura South, Michelle A. Borkin
View presentation:2022-10-19T16:09:00ZGMT-0600Change your timezone on the schedule page
2022-10-19T16:09:00Z
Prerecorded Talk
The live footage of the talk, including the Q&A, can be viewed on the session page, Understanding and Modeling How People Respond to Visualizations.
Fast forward
Abstract
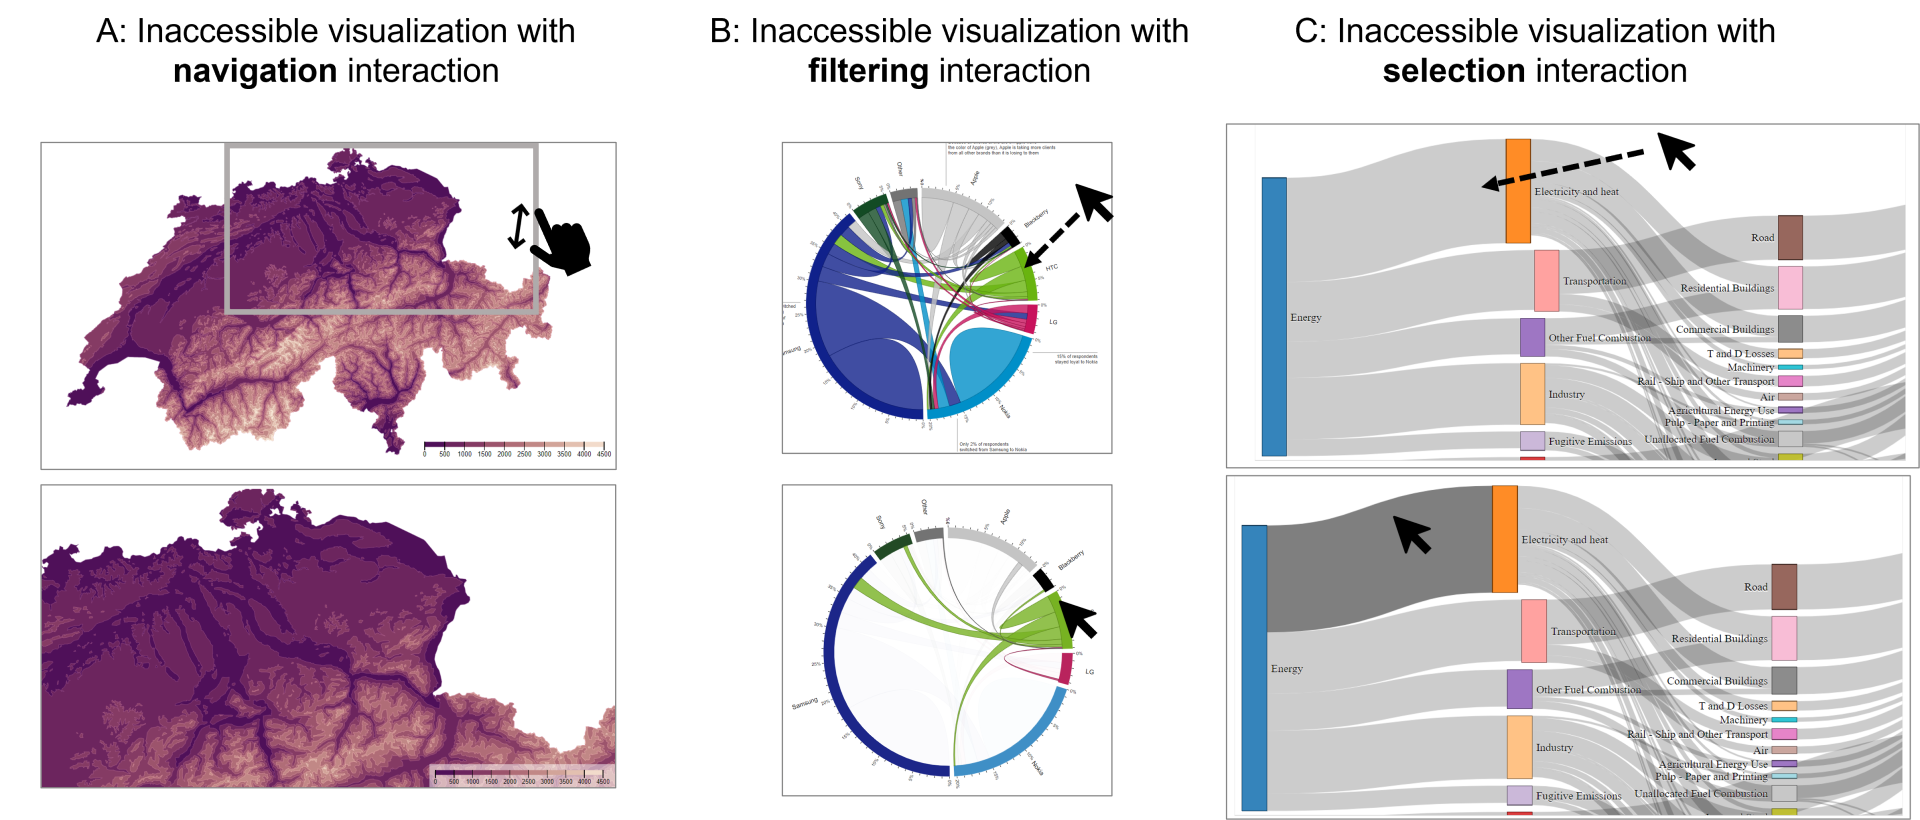
Accessibility guidelines place restrictions on the use of animations and interactivity on webpages to lessen the likelihood of webpages inadvertently producing sequences with flashes, patterns, or color changes that may trigger seizures for individuals with photosensitive epilepsy. Online data visualizations often incorporate elements of animation and interactivity to create a narrative, engage users, or encourage exploration. These design guidelines have been empirically validated by perceptual studies in visualization literature, but the impact of animation and interaction in visualizations on users with photosensitivity, who may experience seizures in response to certain visual stimuli, has not been considered. We systematically gathered and tested 1,132 interactive and animated visualizations for seizure-inducing risk using established methods and found that currently available methods for determining photosensitive risk are not reliable when evaluating interactive visualizations, as risk scores varied significantly based on the individual interacting with the visualization. To address this issue, we introduce a theoretical model defining the degree of control visualization designers have over three determinants of photosensitive risk in potentially seizure-inducing sequences: the size, frequency, and color of flashing content. Using an analysis of 375 visualizations hosted on bl.ocks.org, we created a theoretical model of photosensitive risk in visualizations by arranging the photosensitive risk determinants according to the degree of control visualization authors have over whether content exceeds photosensitive accessibility thresholds. We then use this model to propose a new method of testing for photosensitive risk that focuses on elements of visualizations that are subject to greater authorial control – and are therefore more robust to variations in the individual user – producing more reliable risk assessments than existing methods when applied to interactive visualizations. A full copy of this paper and all study materials are available at https://osf.io/8kzmg/.