LargeNetVis: visual exploration of large temporal networks based on community taxonomies
Claudio Linhares, Jean Roberto Ponciano, Diogenes Pedro, Luis Rocha, Agma Traina, Jorge Poco
View presentation:2022-10-19T14:36:00ZGMT-0600Change your timezone on the schedule page
2022-10-19T14:36:00Z
Prerecorded Talk
The live footage of the talk, including the Q&A, can be viewed on the session page, Temporal Data.
Fast forward
Abstract
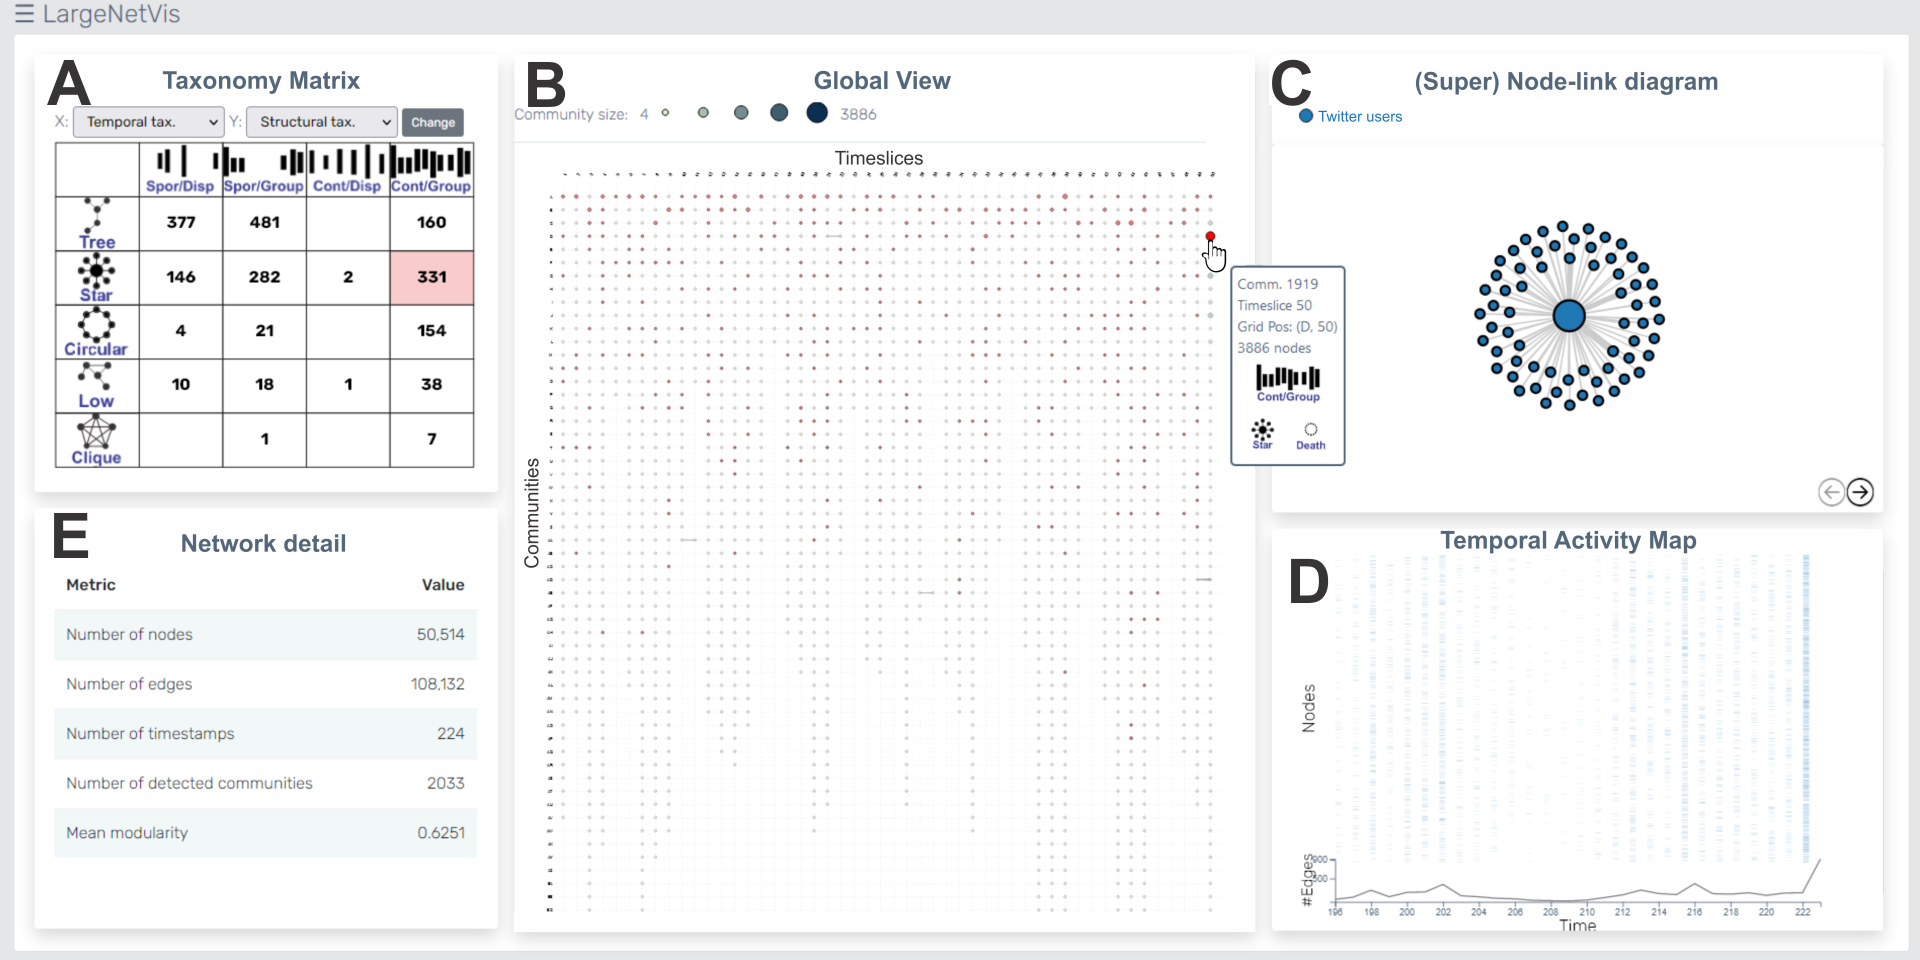
Temporal (or time-evolving) networks are commonly used to model complex systems and the evolution of their components throughout time. Although these networks can be analyzed by different means, visual analytics stands out as an effective way for a pre-analysis before doing quantitative/statistical analyses to identify patterns, anomalies, and other behaviors in the data, thus leading to new insights and better decision-making. However, the large number of nodes, edges, and/or timestamps in many real-world networks may lead to polluted layouts that make the analysis inefficient or even infeasible. In this paper, we propose LargeNetVis, a web-based visual analytics system designed to assist in analyzing small and large temporal networks. It successfully achieves this goal by leveraging three taxonomies focused on network communities to guide the visual exploration process. The system is composed of four interactive visual components: the first (Taxonomy Matrix) presents a summary of the network characteristics, the second (Global View) gives an overview of the network evolution, the third (a node-link diagram) enables community- and node-level structural analysis, and the fourth (a Temporal Activity Map -- TAM) shows the community- and node-level activity under a temporal perspective. We demonstrate the usefulness and effectiveness of LargeNetVis through two usage scenarios and a user study with 14 participants.