Traveler: Navigating Task Parallel Traces for Performance Analysis
Sayef Azad Sakin, Alex Bigelow, Mohammad Tohid, Connor Scully-Allison, Carlos Scheidegger, Steven Robert Brandt, Christopher P. Taylor, Kevin A. Huck, Hartmut Kaiser, Katherine E. Isaacs
View presentation:2022-10-20T16:21:00ZGMT-0600Change your timezone on the schedule page
2022-10-20T16:21:00Z
Prerecorded Talk
The live footage of the talk, including the Q&A, can be viewed on the session page, Digital Humanities, e-Commerce, and Engineering.
Fast forward
Abstract
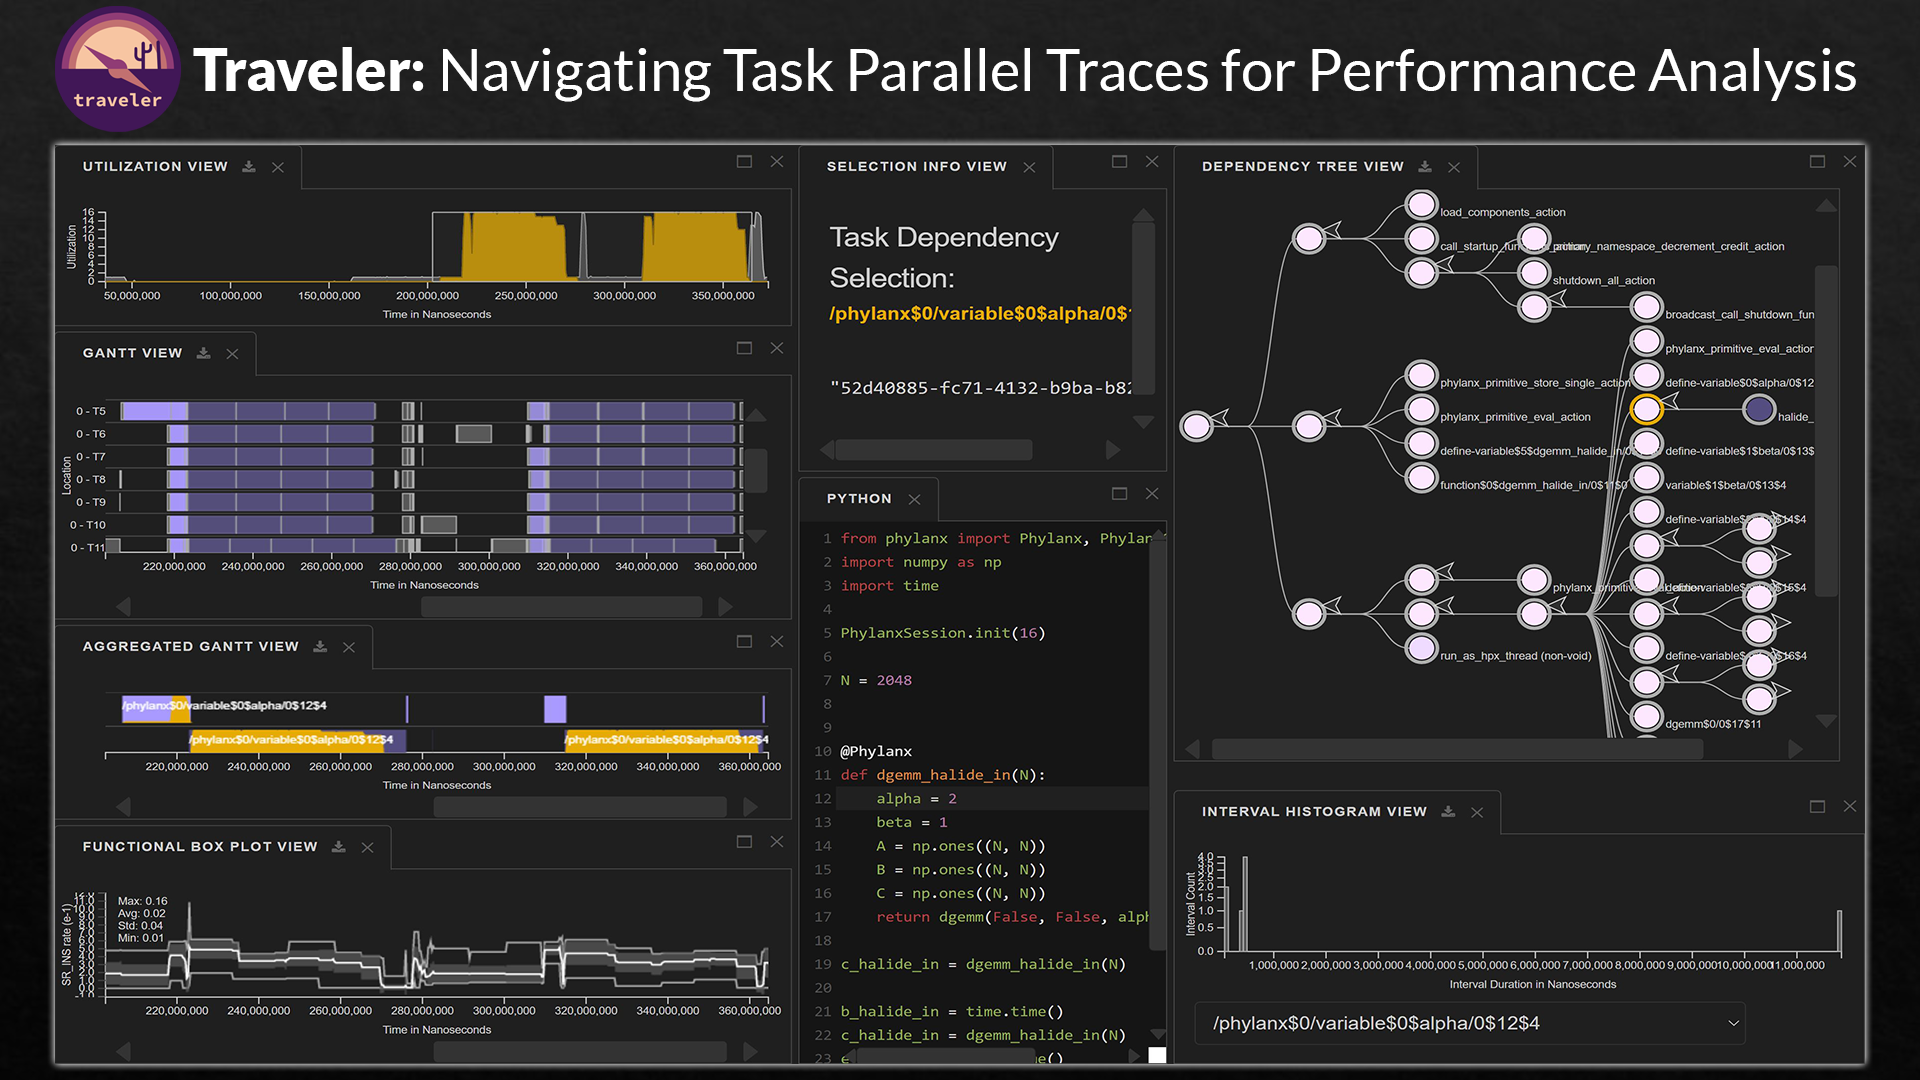
Understanding the behavior of software in execution is a key step in identifying and fixing performance issues. This is especially important in high performance computing contexts where even minor performance tweaks can translate into large savings in terms of computational resource use. To aid performance analysis, developers may collect an execution trace—a chronological log of program activity during execution. As traces represent the full history, developers can discover a wide array of possibly previously unknown performance issues, making them an important artifact for exploratory performance analysis. However, interactive trace visualization is difficult due to issues of data size and complexity of meaning. Traces represent nanosecond-level events across many parallel processes, meaning the collected data is often large and difficult to explore. The rise of asynchronous task parallel programming paradigms complicates the relation between events and their probable cause. To address these challenges, we conduct a continuing design study in collaboration with high performance computing researchers. We develop diverse and hierarchical ways to navigate and represent execution trace data in support of their trace analysis tasks. Through an iterative design process, we developed Traveler, an integrated visualization platform for task parallel traces. Traveler provides multiple linked interfaces to help navigate trace data from multiple contexts. We evaluate the utility of Traveler through feedback from users and a case study, finding that integrating multiple modes of navigation in our design supported performance analysis tasks and led to the discovery of previously unknown behavior in a distributed array library.