Visualizing Ensemble Predictions of Music Mood
Zelin Ye, Min Chen
View presentation:2022-10-20T16:45:00ZGMT-0600Change your timezone on the schedule page
2022-10-20T16:45:00Z
Prerecorded Talk
The live footage of the talk, including the Q&A, can be viewed on the session page, Interpreting Machine Learning.
Fast forward
Abstract
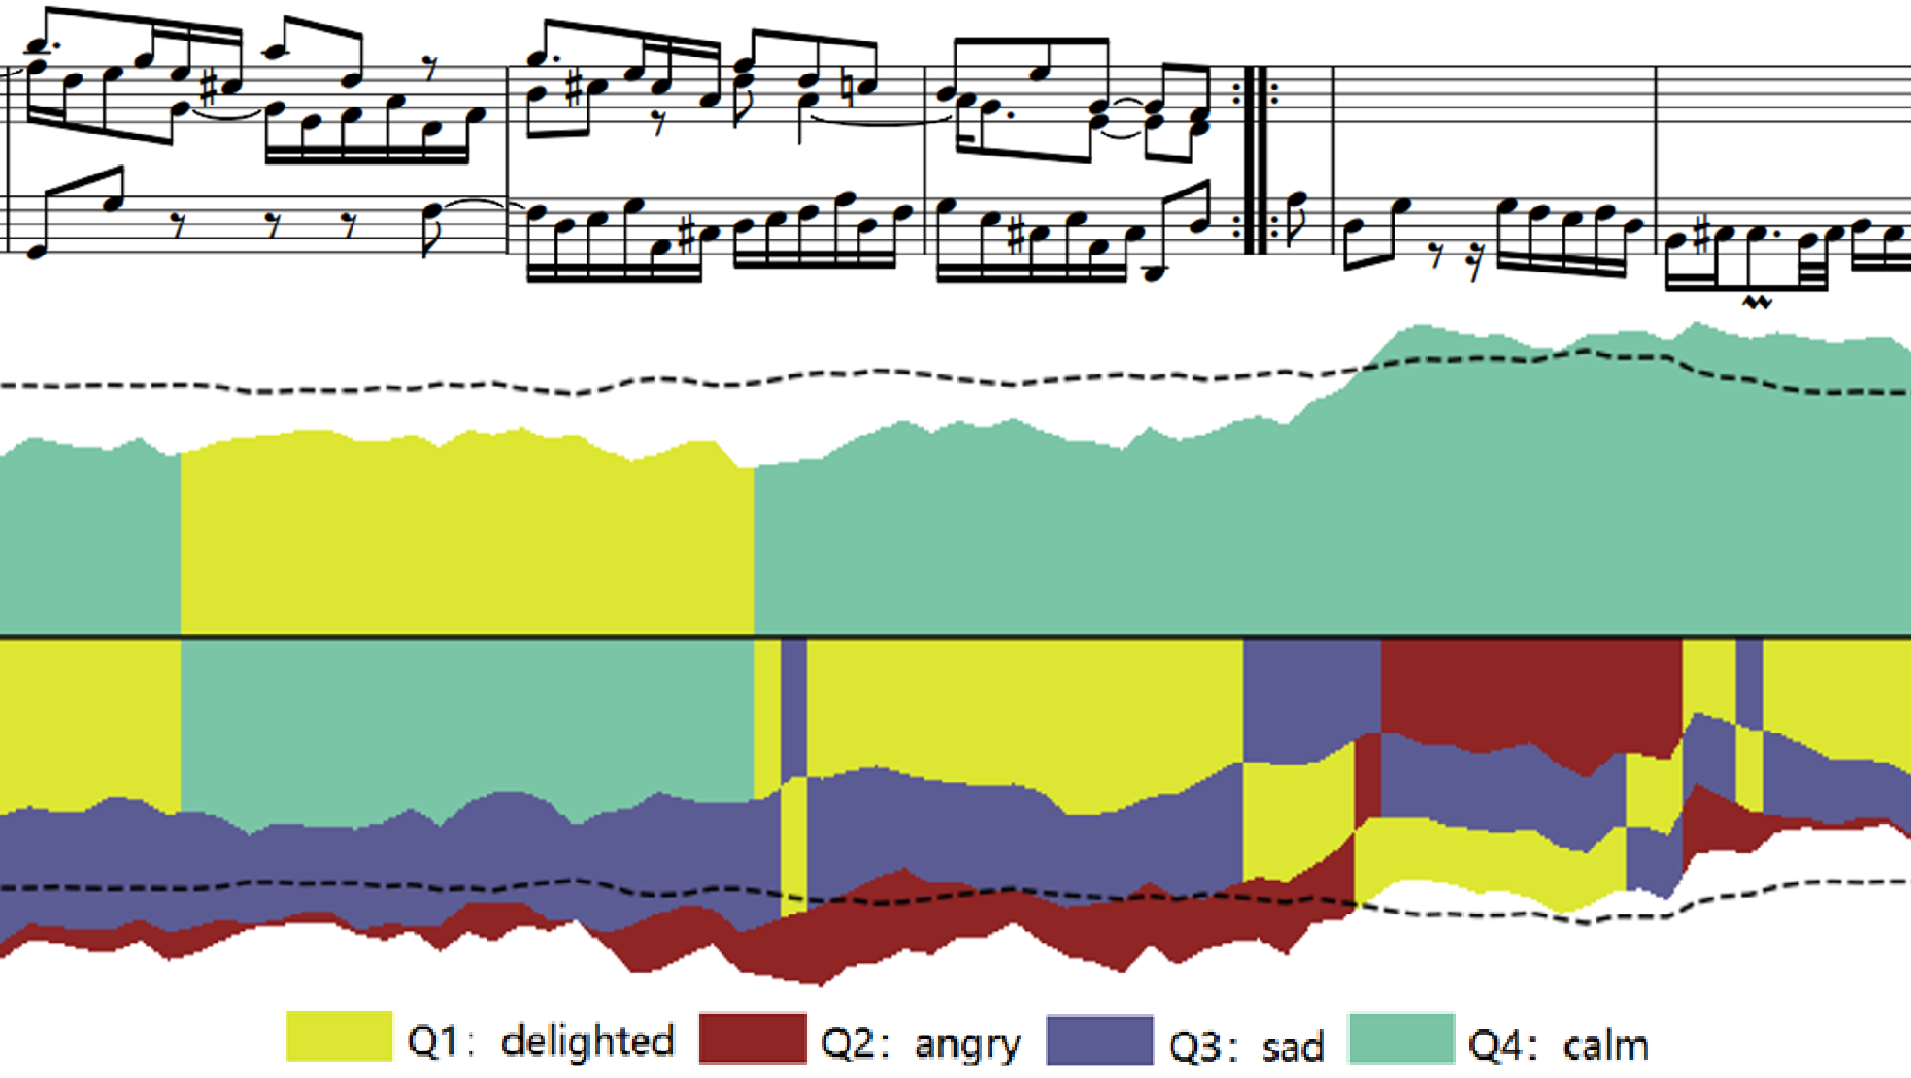
Music mood classification has been a challenging problem in comparison with other music classification problems (e.g., genre, composer, or period). One solution for addressing this challenge is to use an ensemble of machine learning models. In this paper, we show that visualization techniques can effectively convey the popular prediction as well as uncertainty at different music sections along the temporal axis while enabling the analysis of individual ML models in conjunction with their application to different musical data. In addition to the traditional visual designs, such as stacked line graph, ThemeRiver, and pixel-based visualization, we introduce a new variant of ThemeRiver, called ``dual-flux ThemeRiver'', which allows viewers to observe and measure the most popular prediction more easily than stacked line graph and ThemeRiver. Together with pixel-based visualization, dual-flux ThemeRiver plots can also assist in model-development workflows, in addition to annotating music using ensemble model predictions.