MetaGlyph: Automatic Generation of Metaphoric Glyph-based Visualization
Lu Ying, Yuchen Yang, Xinhuan Shu, Dazhen Deng, Tan Tang, Lingyun Yu, Yingcai Wu
View presentation:2022-10-19T16:21:00ZGMT-0600Change your timezone on the schedule page
2022-10-19T16:21:00Z
Prerecorded Talk
The live footage of the talk, including the Q&A, can be viewed on the session page, Visualization Design.
Fast forward
Abstract
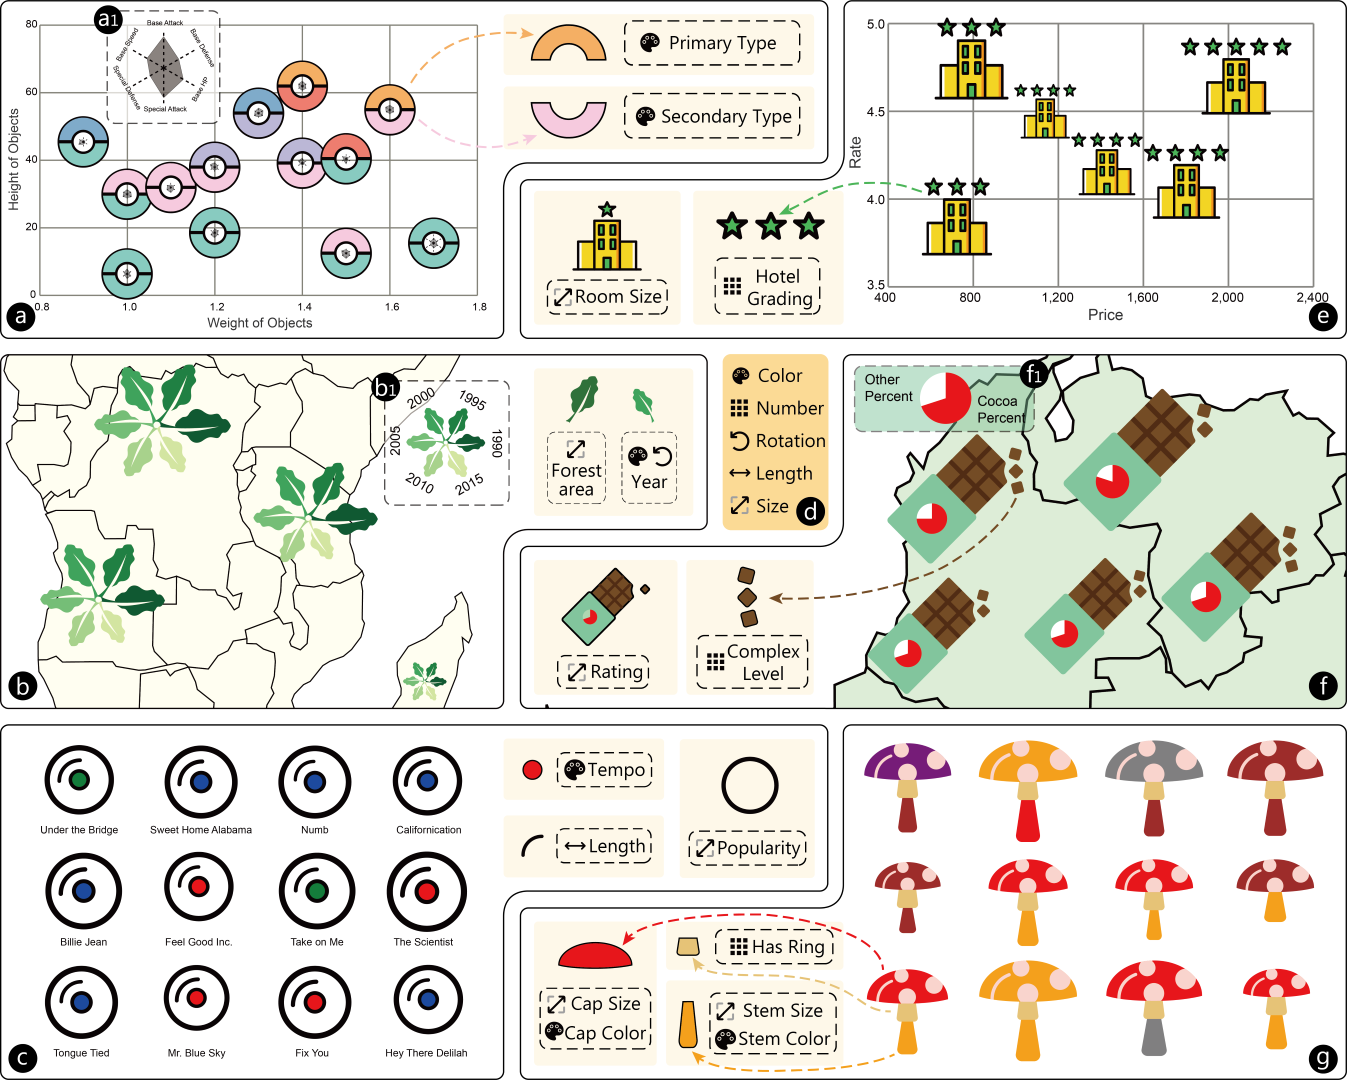
Glyph-based visualization achieves an impressive graphic design when associated with comprehensive visual metaphors, which help audiences effectively grasp the conveyed information through revealing data semantics. However, creating such metaphoric glyph-based visualization (MGV) is not an easy task, as it requires not only a deep understanding of data but also professional design skills. This paper proposes MetaGlyph, an automatic system for generating MGVs from a spreadsheet. To develop MetaGlyph, we first conduct a qualitative analysis to understand the design of current MGVs from the perspectives of metaphor embodiment and glyph design. Based on the results, we introduce a novel framework for generating MGVs by metaphoric image selection and an MGV construction. Specifically, MetaGlyph automatically selects metaphors with corresponding images from online resources based on the input data semantics. We then integrate a Monte Carlo tree search algorithm that explores the design of an MGV by associating visual elements with data dimensions given the data importance, semantic relevance, and glyph non-overlap. The system also provides editing feedback that allows users to customize the MGVs according to their design preferences. We demonstrate the use of MetaGlyph through a set of examples, one usage scenario, and validate its effectiveness through a series of expert interviews.