GRay: Ray Casting for Visualization and Interactive Data Exploration of Gaussian Mixture Models
Kai Lawonn, Monique Meuschke, Pepe Eulzer, Matthias Mitterreiter, Joachim Giesen, Tobias Günther
View presentation:2022-10-19T19:12:00ZGMT-0600Change your timezone on the schedule page
2022-10-19T19:12:00Z
Prerecorded Talk
The live footage of the talk, including the Q&A, can be viewed on the session page, (Volume) Rendering.
Fast forward
Abstract
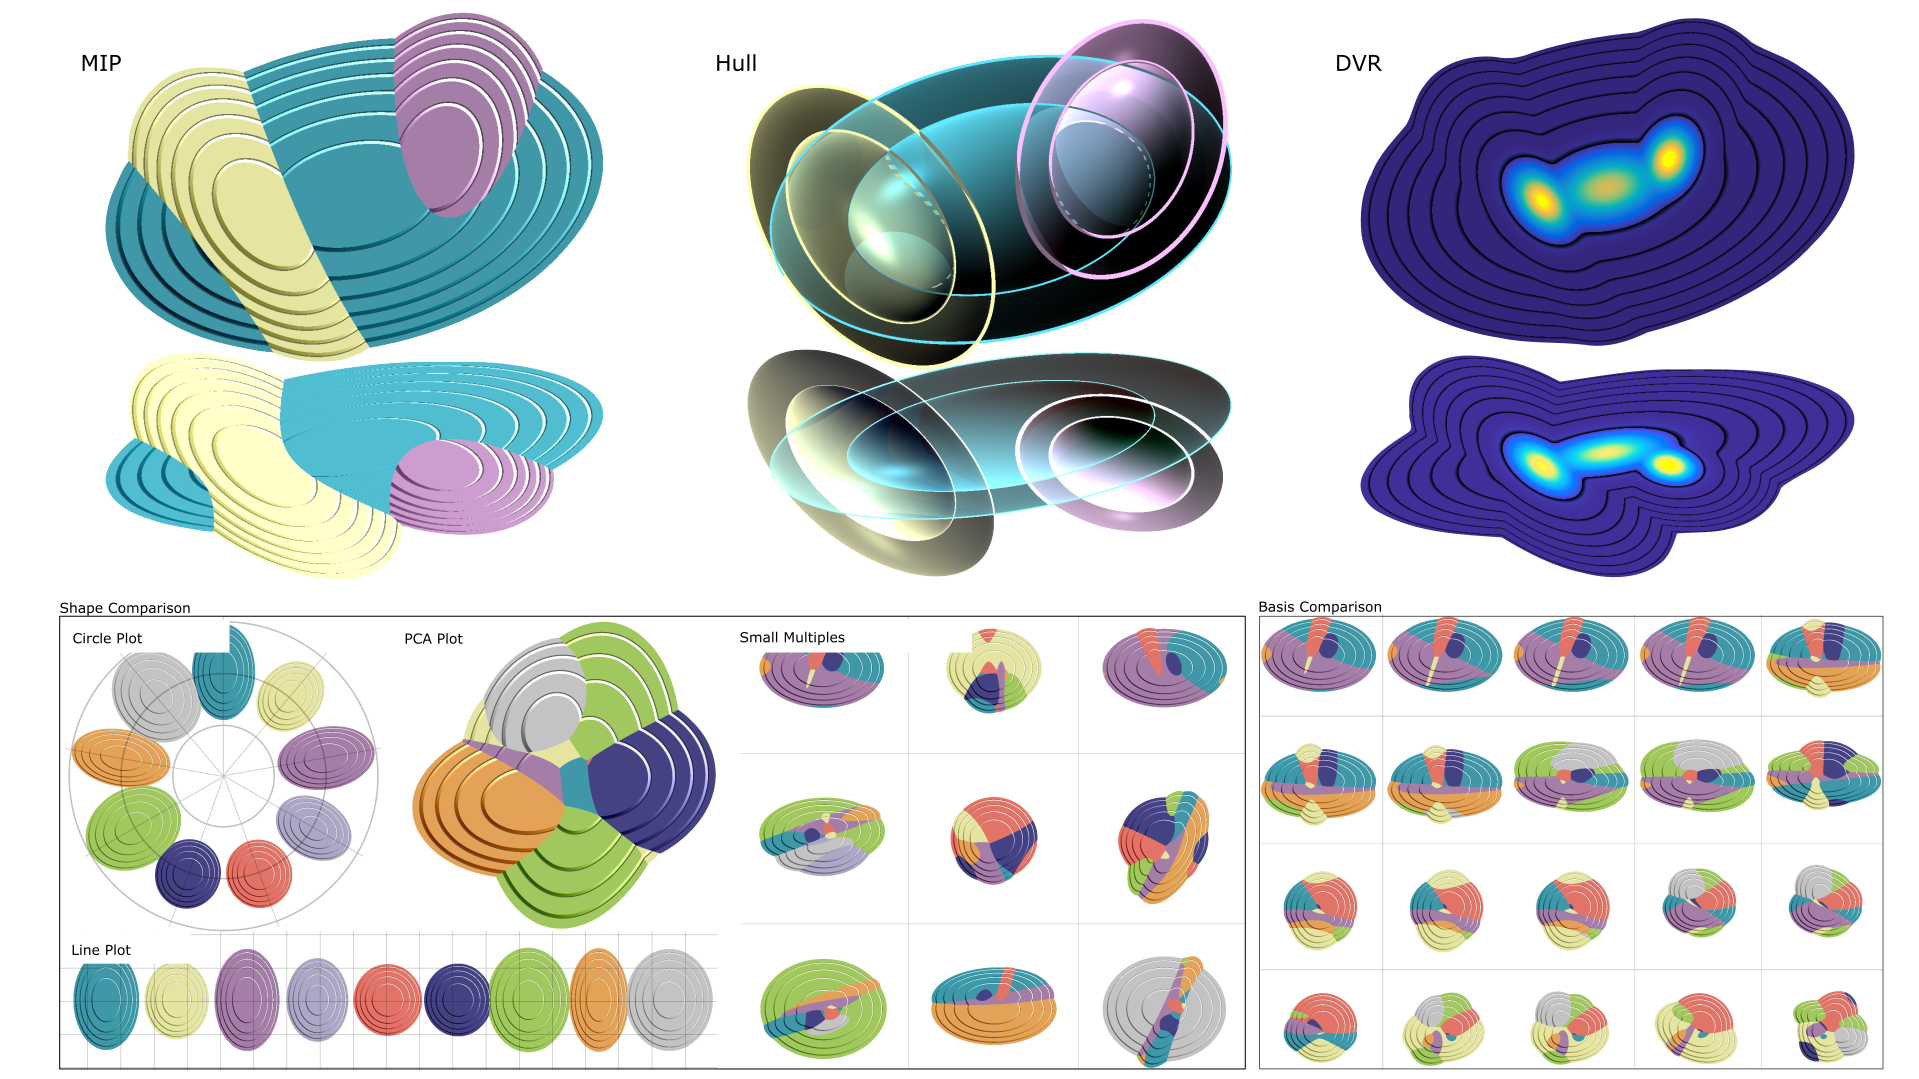
The Gaussian mixture model (GMM) describes the distribution of random variables from several different populations. GMMs have widespread applications in probability theory, statistics, machine learning for unsupervised cluster analysis and topic modeling, as well as in deep learning pipelines. So far, few efforts have been made to explore the underlying point distribution in combination with the GMMs, in particular when the data becomes high-dimensional and when the GMMs are composed of many Gaussians. We present an analysis tool comprising various GPU-based visualization techniques to explore such complex GMMs. To facilitate the exploration of high-dimensional data, we provide a novel navigation system to analyze the underlying data. Instead of projecting the data to 2D, we utilize interactive 3D views to better support users in understanding the spatial arrangements of the Gaussian distributions. The interactive system is composed of two parts: (1) raycasting-based views that visualize cluster memberships, spatial arrangements, and support the discovery of new modes. (2) overview visualizations that enable the comparison of Gaussians with each other, as well as small multiples of different choices of basis vectors. Users are supported in their exploration with customization tools and smooth camera navigations. Our tool was developed and assessed by five domain experts, and its usefulness was evaluated with 23 participants. To demonstrate the effectiveness, we identify interesting features in several data sets.