Understanding how Designers Find and Use Data Visualization Examples
Hannah K. Bako, Xinyi Liu, Leilani Battle, Zhicheng Liu
View presentation:2022-10-20T20:00:00ZGMT-0600Change your timezone on the schedule page
2022-10-20T20:00:00Z
Prerecorded Talk
The live footage of the talk, including the Q&A, can be viewed on the session page, Reflecting on Academia and our Field.
Fast forward
Abstract
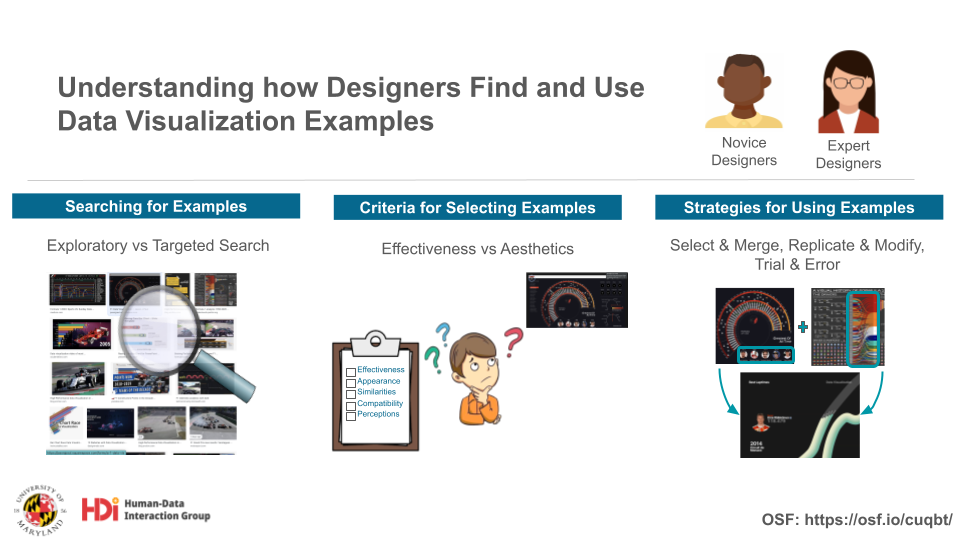
Examples are useful for inspiring ideas and facilitating implementation in visualization design. However, there is little understanding of how visualization designers use examples, and how computational tools may support such activities. In this paper, we contribute an exploratory study of current practices in incorporating visualization examples. We conducted semi-structured interviews with 15 university students and 15 professional designers. Our analysis focus on two core design activities: searching for examples and utilizing examples. We characterize observed strategies and tools for performing these activities, as well as major challenges that hinder designers’ current workflows. In addition, we identify themes that cut across these two activities: criteria for determining example usefulness, curation practices, and design fixation. Given our findings, we discuss the implications for visualization design and authoring tools and highlight critical areas for future research.