Interactive Visual Analysis of Structure-borne Noise Data
Rainer Splechtna, Denis Gracanin, Goran Todorovic, Stanislav Goja, Boris Bedic, Helwig Hauser, Kresimir Matkovic
View presentation:2022-10-20T16:09:00ZGMT-0600Change your timezone on the schedule page
2022-10-20T16:09:00Z
Prerecorded Talk
The live footage of the talk, including the Q&A, can be viewed on the session page, Digital Humanities, e-Commerce, and Engineering.
Fast forward
Abstract
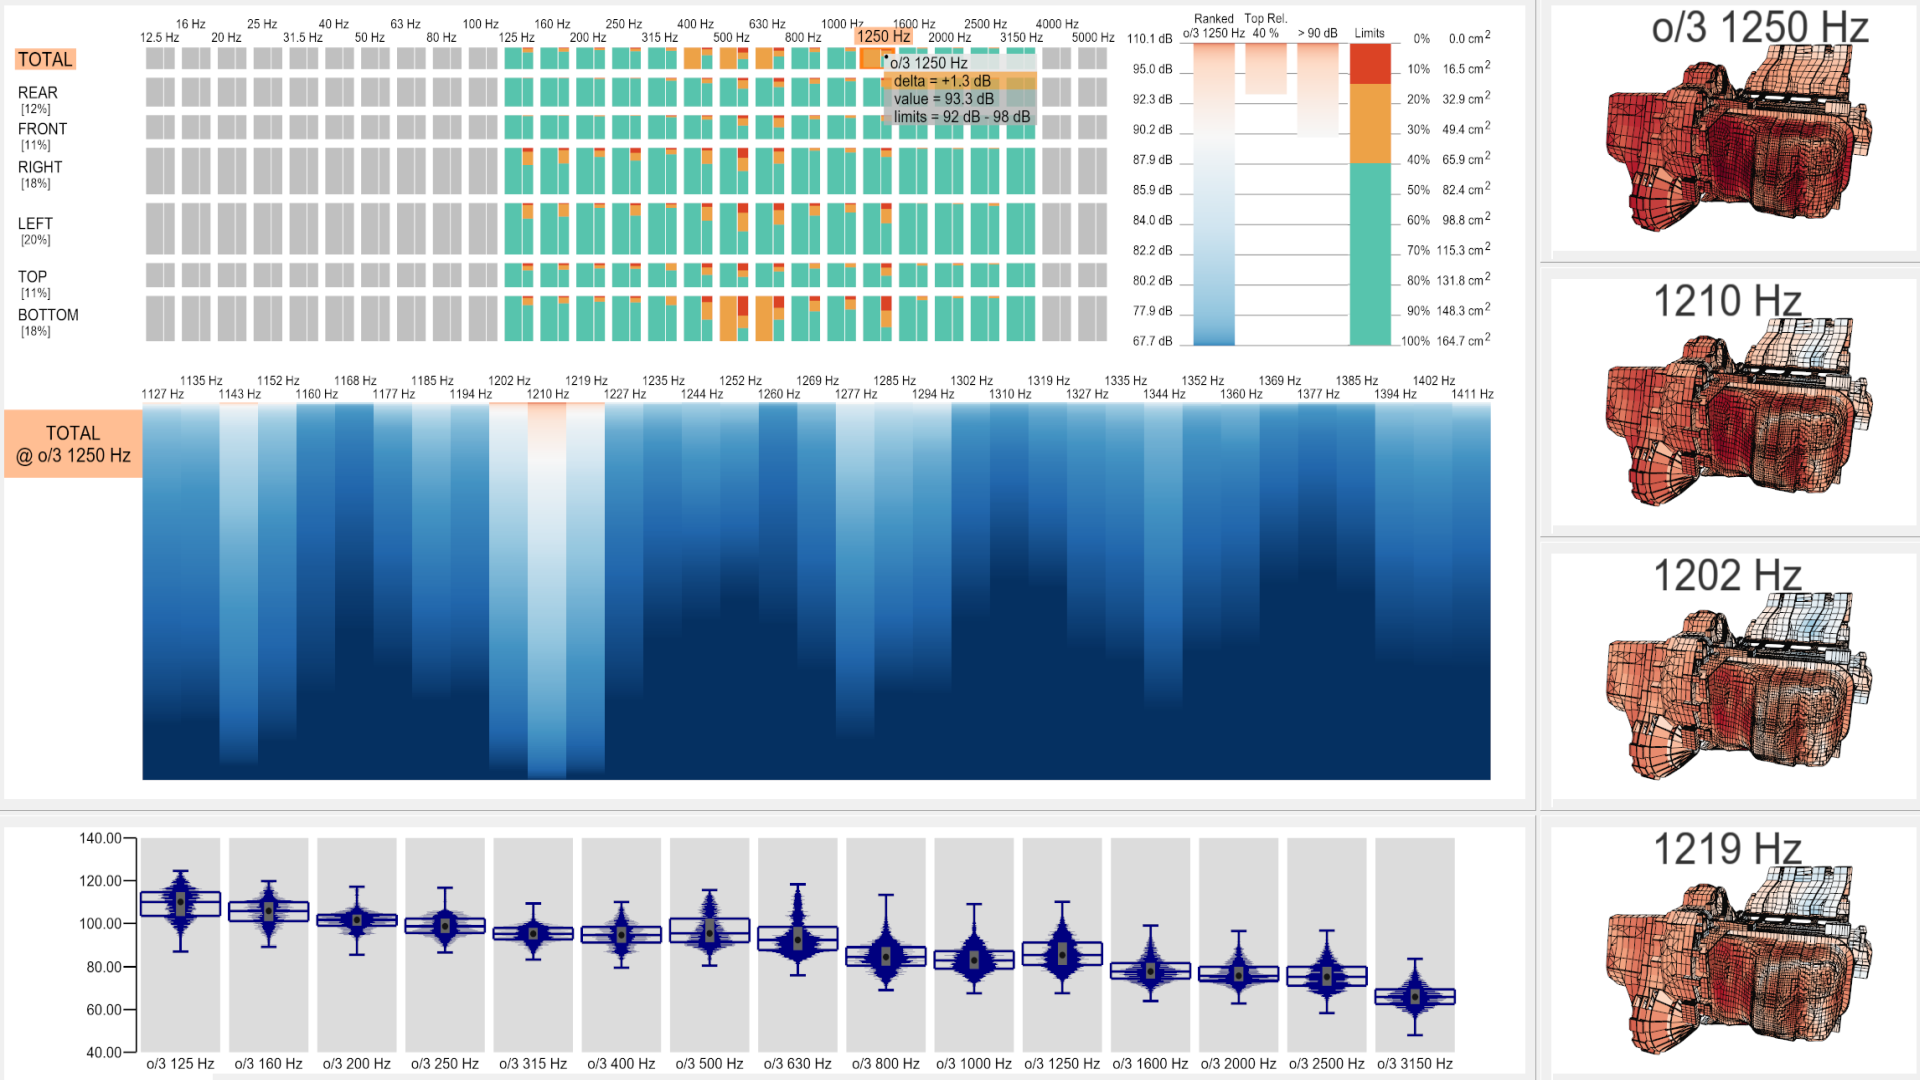
Numerical simulation has become omnipresent in the automotive domain, posing new challenges such as high-dimensional parameter spaces and large as well as incomplete and multi-faceted data. In this design study, we show how interactive visual exploration and analysis of high-dimensional, spectral data from noise simulation can facilitate design improvements in the context of conflicting criteria. Here, we focus on structure-borne noise, i.e., noise from vibrating mechanical parts. Detecting problematic noise sources early in the design and production process is essential for reducing a product’s development costs and its time to market. In a close collaboration of visualization and automotive engineering, we designed a new, interactive approach to quickly identify and analyze critical noise sources, also contributing to an improved understanding of the analyzed system. Several carefully designed, interactive linked views enable the exploration of noises, vibrations, and harshness at multiple levels of detail, both in the frequency and spatial domain. This enables swift and smooth changes of perspective; selections in the frequency domain are immediately reflected in the spatial domain, and vice versa. Noise sources are quickly identified and shown in the context of their neighborhood, both in the frequency and spatial domain. We propose a novel drill-down view, especially tailored to noise data analysis. Split boxplots and synchronized 3D geometry views support comparison tasks. With this solution, engineers iterate over design optimizations much faster, while maintaining a good overview at each iteration. We evaluated the new approach in the automotive industry, studying noise simulation data for an internal combustion engine.