Relaxed Dot Plots: Faithful Visualization of Samples and Their Distribution
Nils Rodrigues, Christoph Schulz, Sören Döring, Daniel Baumgartner, Tim Krake, Daniel Weiskopf
View presentation:2022-10-19T16:45:00ZGMT-0600Change your timezone on the schedule page
2022-10-19T16:45:00Z

Prerecorded Talk
The live footage of the talk, including the Q&A, can be viewed on the session page, Visualization Opportunities.
Fast forward
Abstract
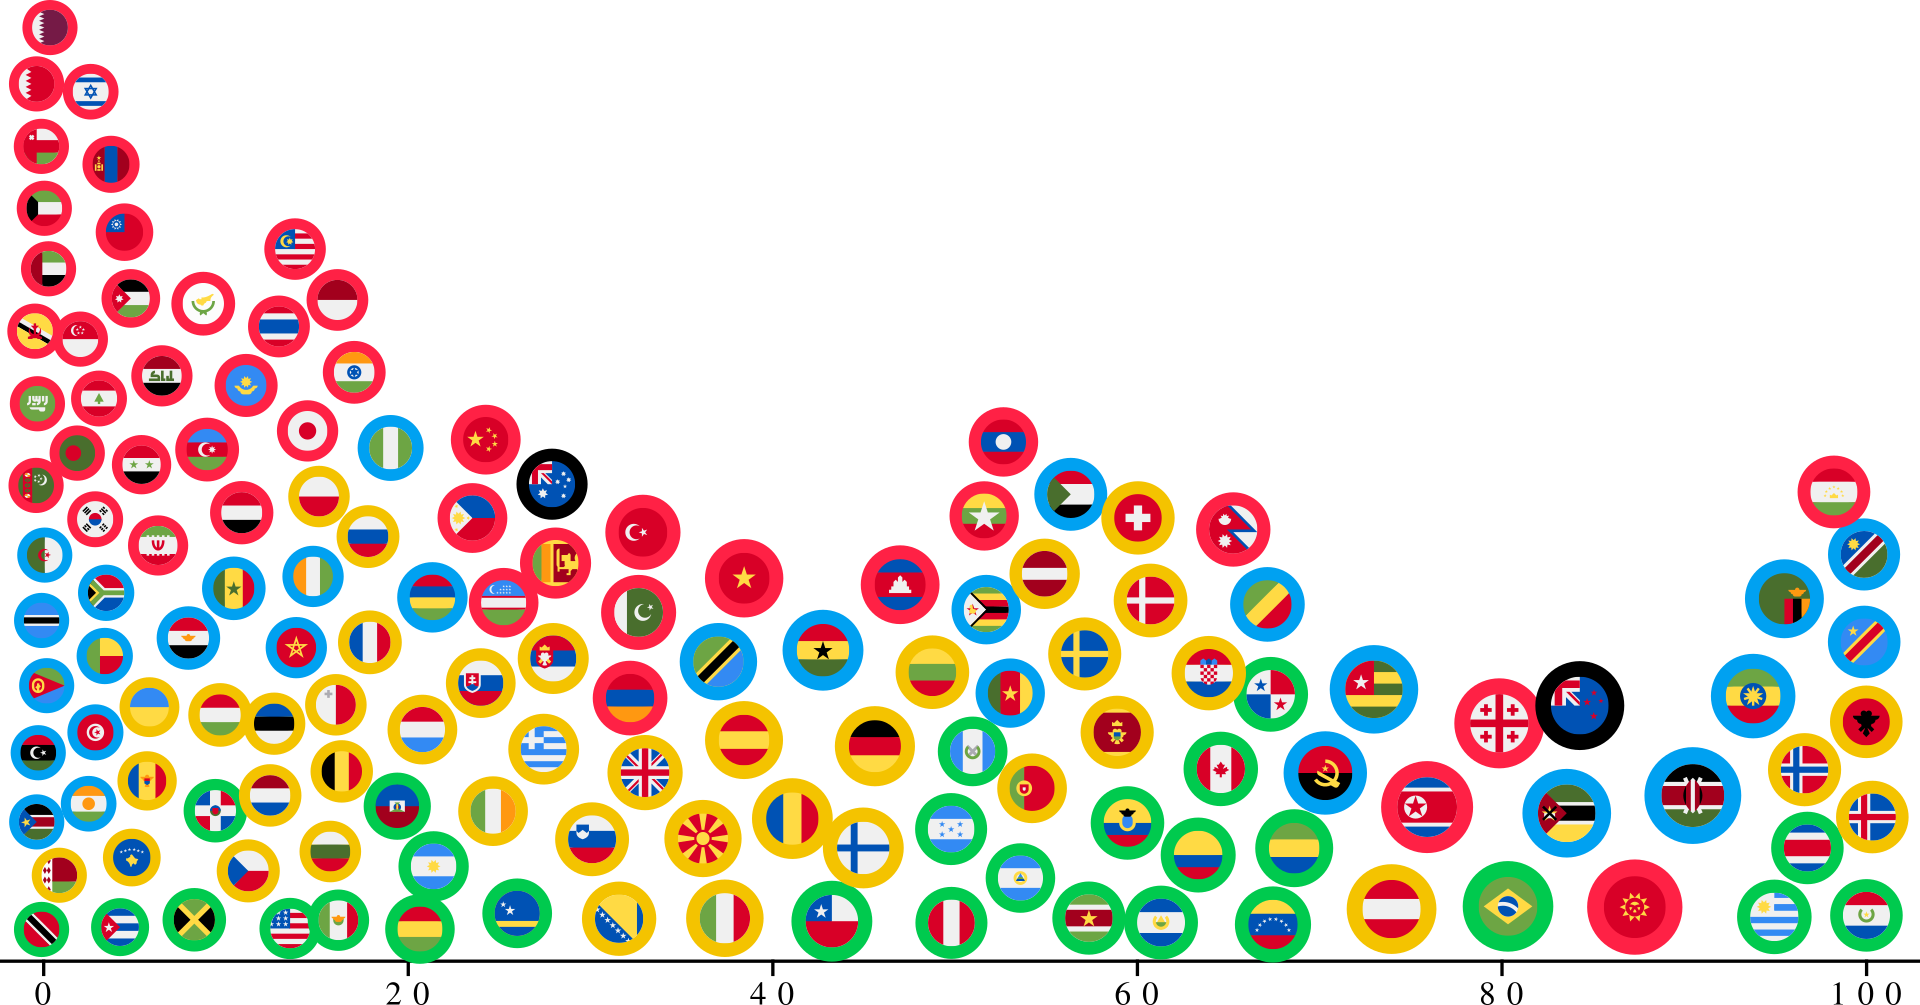
We introduce relaxed dot plots as an improvement of nonlinear dot plots for unit visualization. Our plots produce more faithful data representations and reduce moiré effects. Their contour is based on a customized kernel frequency estimation to match the shape of the distribution of underlying data values. Previous nonlinear layouts introduce column-centric nonlinear scaling of dot diameters for visualization of high-dynamic-range data with high peaks. We provide a mathematical approach to convert that column-centric scaling to our smooth envelope shape. This formalism allows us to use linear, root, and logarithmic scaling to find ideal dot sizes. Our method iteratively relaxes the dot layout for more correct and aesthetically pleasing results. To achieve this, we modified Lloyd's algorithm with additional constraints and heuristics. We evaluate the layouts of relaxed dot plots against a previously existing nonlinear variant and show that our algorithm produces less error regarding the underlying data while establishing the blue noise property that works against moiré effects. Further, we analyze the readability of our relaxed plots in three crowd-sourced experiments. The results indicate that our proposed technique surpasses traditional dot plots.