PC-Expo: A Metrics-Based Interactive Axes Reordering Method for Parallel Coordinate Displays
Anjul Kumar Tyagi, Tyler Estro, Geoff Kuenning, Erez Zadok, Klaus Mueller
View presentation:2022-10-20T14:12:00ZGMT-0600Change your timezone on the schedule page
2022-10-20T14:12:00Z
Prerecorded Talk
The live footage of the talk, including the Q&A, can be viewed on the session page, Interactive Dimensionality (High Dimensional Data).
Fast forward
Abstract
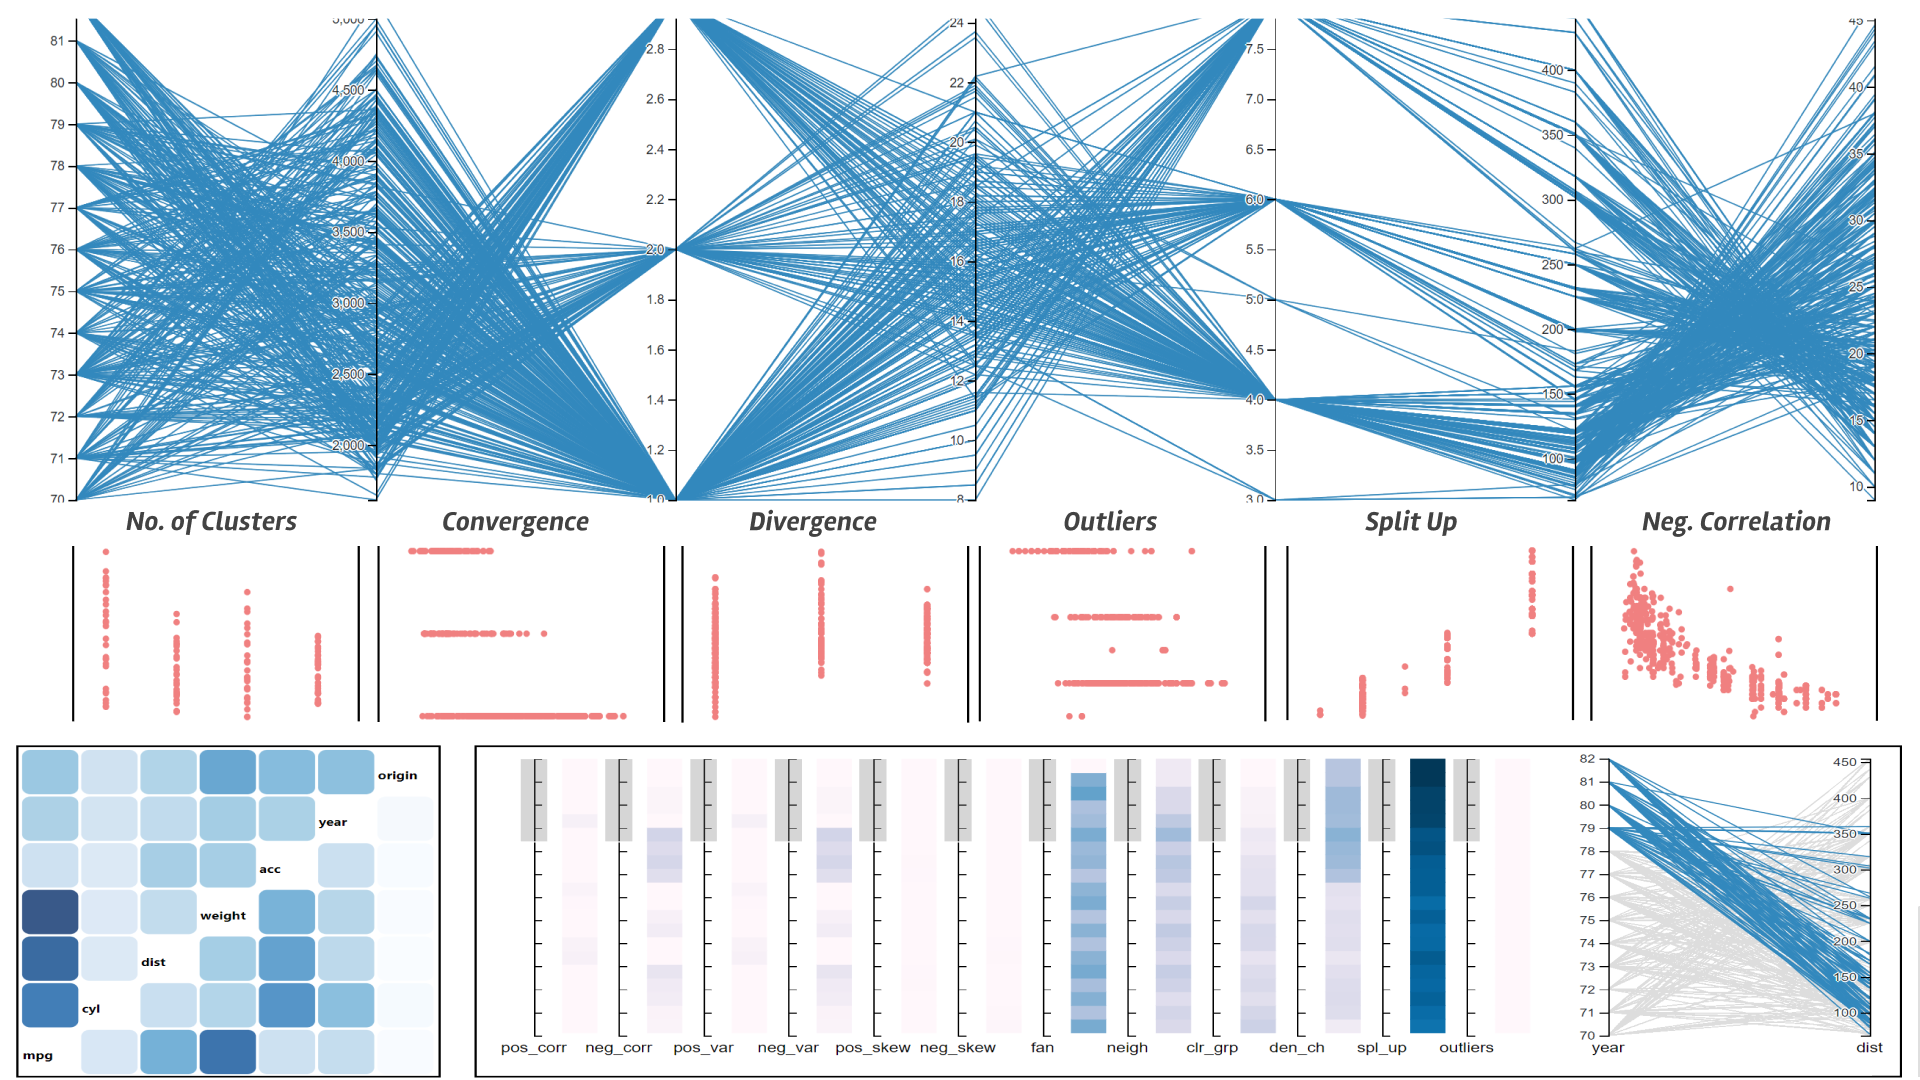
Parallel coordinate plots (PCPs) have been widely used for high-dimensional (HD) data storytelling because they allow presenting a large number of dimensions without distortions. The axes ordering in PCP presents a particular story from the data based on the user perception of PCP polylines. Existing works focus on directly optimizing for PCP axes ordering based on some common analysis tasks like clustering, neighborhood, and correlation. However, direct optimization for PCP axes based on these common properties is restrictive because it does not account for multiple properties occurring between the axes, and for local properties that occur in small regions in the data. Also, many of these techniques do not support the human-in-the-loop (HIL) paradigm, which is crucial (i) for explainability and (ii) in cases where no single reordering scheme fits the users’ goals. To alleviate these problems, we present PC-Expo, a real-time visual analytics framework for all-in-one PCP line pattern detection, and axes reordering. We studied the connection of line patterns in PCPs with different data analysis tasks and datasets. PC-Expo expands prior work on PCP axes reordering by developing real-time, local detection schemes for the 12 most common analysis tasks (properties). Users can choose the story they want to present with PCPs by optimizing directly over their choice of properties. These properties can be ranked, or combined using individual weights, creating a custom optimization scheme for axes reordering. Users can control the granularity at which they want to work with their detection scheme in the data, allowing exploration of local regions. PC-Expo also supports HIL axes reordering via local-property visualization, which shows the regions of granular activity for every axis pair. Local-property visualization is helpful for PCP axes reordering based on multiple properties, when no single reordering scheme fits the user goals. A comprehensive evaluation done with real users and diverse datasets confirms the efficacy of PC-Expo in data storytelling with PCPs.