Multiple Forecast Visualizations (MFVs): Trade-offs in Trust and Performance in Multiple COVID-19 Forecast Visualizations
Lace Padilla, Racquel Fygenson, Spencer C. Castro, Enrico Bertini
View presentation:2022-10-18T16:15:00ZGMT-0600Change your timezone on the schedule page
2022-10-18T16:15:00Z
Prerecorded Talk
The live footage of the talk, including the Q&A, can be viewed on the session page, VIS Opening (10:45am-11:03am)| Best Papers (11:03am-12:00pm).
Fast forward
Abstract
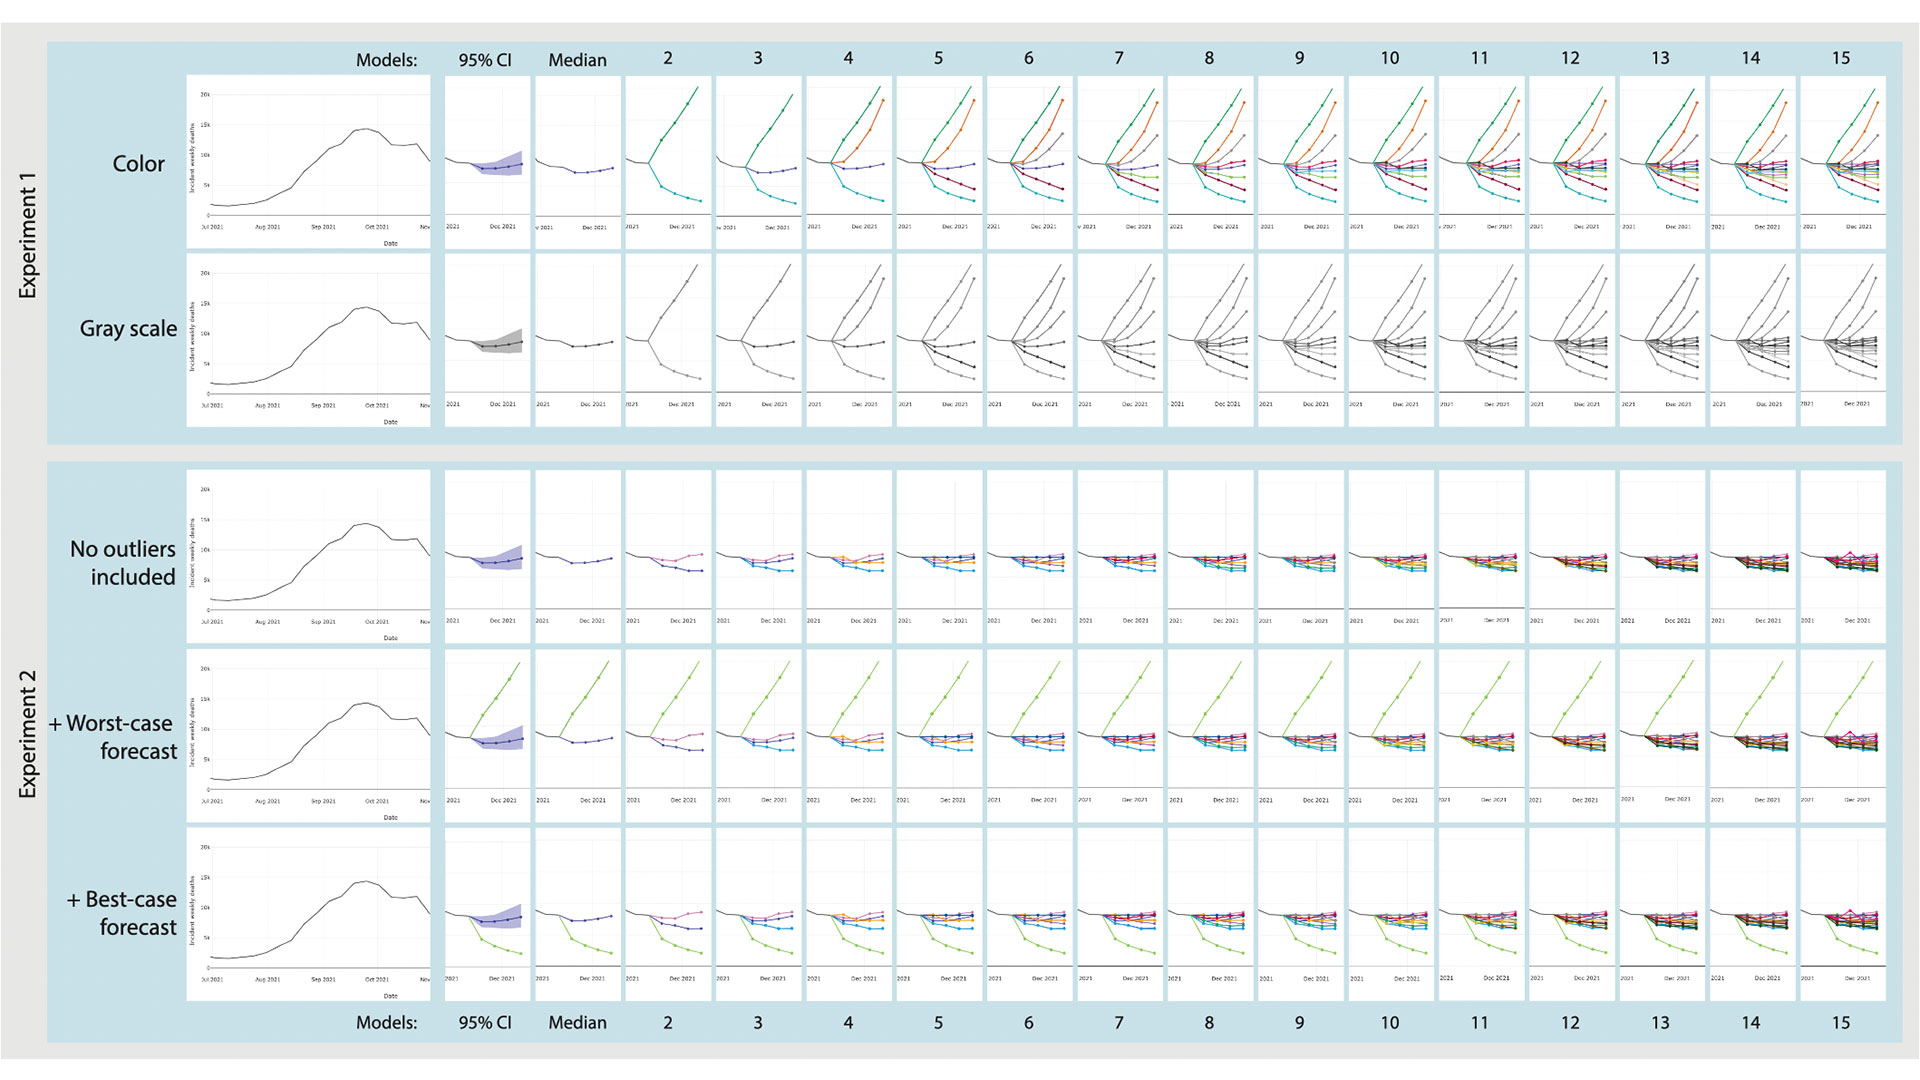
The prevalence of inadequate SARS-COV-2 (COVID-19) responses may indicate a lack of trust in forecasts and risk communication. However, no work has empirically tested how multiple forecast visualization choices impact trust and task-based performance. The three studies presented in this paper (N = 1299) examine how visualization choices impact trust in COVID-19 mortality forecasts and how they influence performance in a trend prediction task. These studies focus on line charts populated with real-time COVID-19 data that varied the number and color encoding of the forecasts and the presence of best/worst-case forecasts. The studies reveal that trust in COVID-19 forecast visualizations initially increases with the number of forecasts and then plateaus after 6-9 forecasts. However, participants were most trusting of visualizations that showed less visual information, including a 95% confidence interval, single forecast, and grayscale encoded forecasts. Participants maintained high trust in intervals labeled with 50% and 25% and did not proportionally scale their trust to the indicated interval size. Despite the high trust, the 95% CI condition was the most likely to evoke predictions that did not correspond with the actual COVID-19 trend. Qualitative analysis of participants’ strategies confirmed that many participants trusted both the simplistic visualizations and those with numerous forecasts. This work provides practical guides for how COVID-19 forecast visualizations influence trust, including recommendations for identifying the range where forecasts balance trade-offs between trust and task-based performance.