Probablement, Wahrscheinlich, Likely ? A Cross-Language Study of How People Verbalize Probabilities in Icon Array Visualizations
Noëlle Rakotondravony, Yiren Ding, Lane Harrison
View presentation:2022-10-21T14:00:00ZGMT-0600Change your timezone on the schedule page
2022-10-21T14:00:00Z

Prerecorded Talk
The live footage of the talk, including the Q&A, can be viewed on the session page, Natural Language Interaction.
Fast forward
Abstract
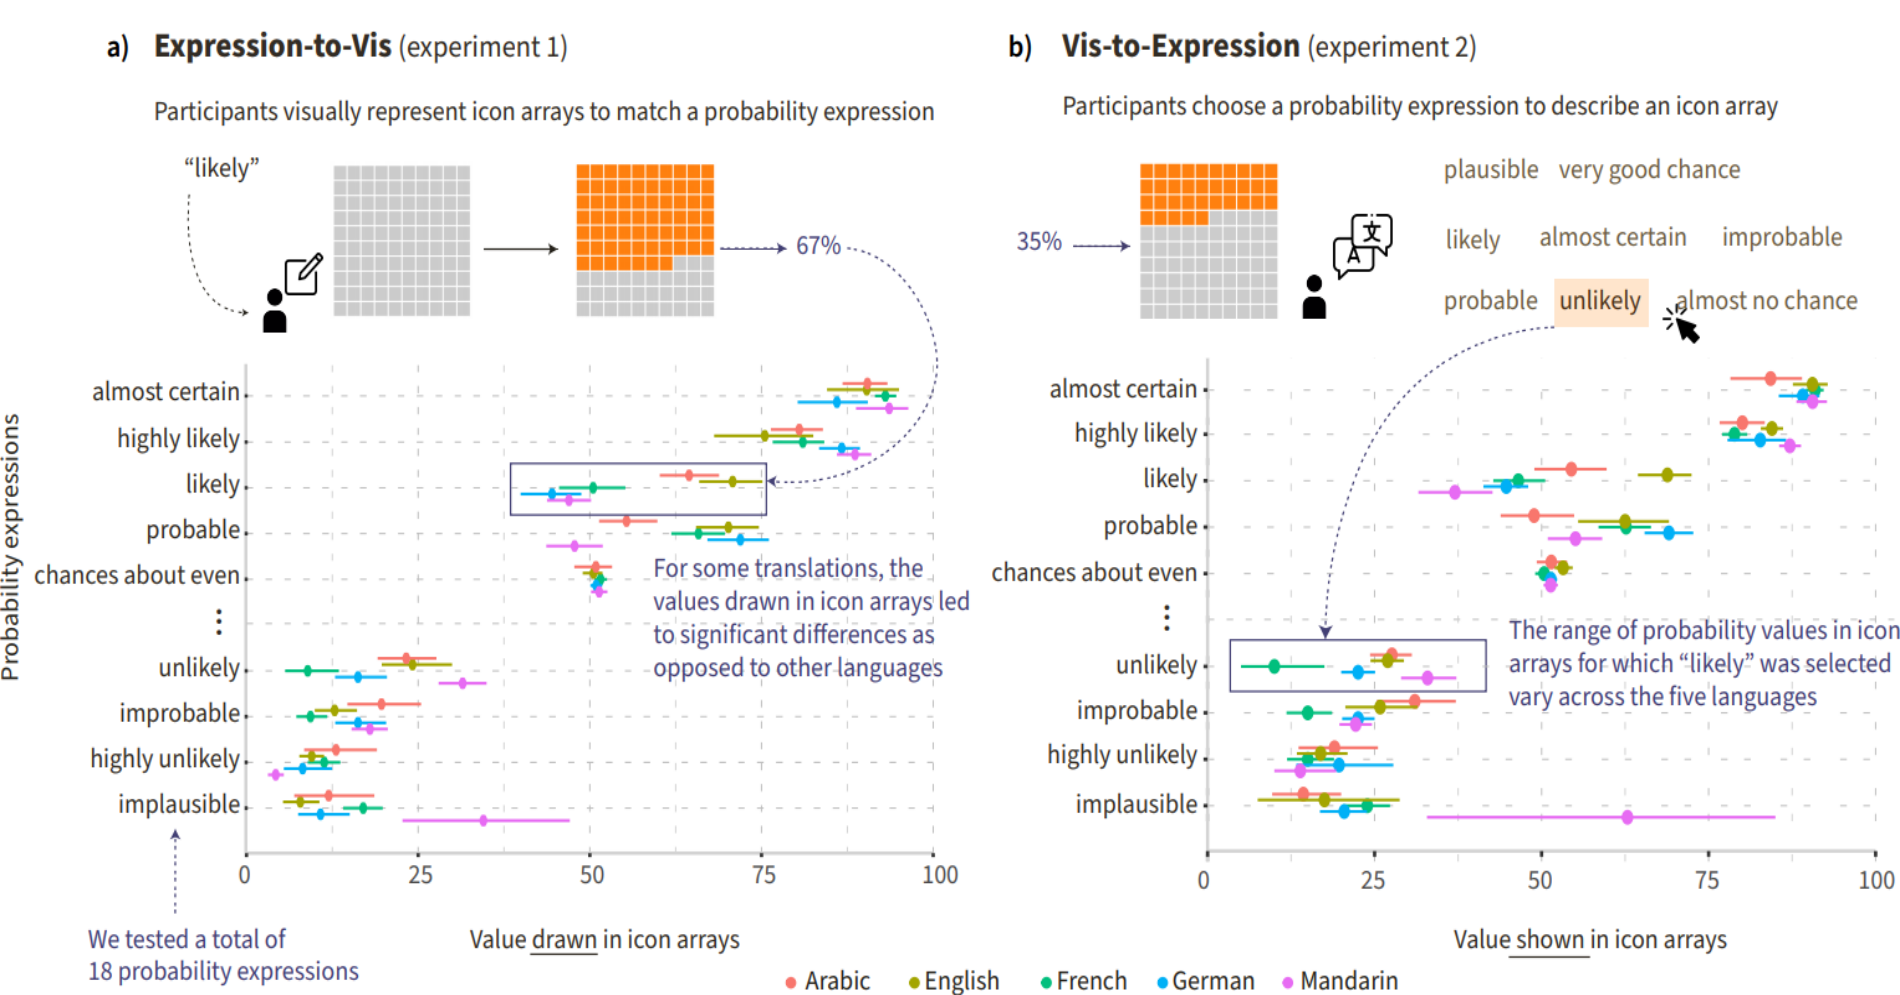
Visualizations today are used across a wide range of languages and cultures. Yet the extent to which language impacts how we reason about data and visualizations remains unclear. In this paper, we explore the intersection of visualization and language through a cross-language study on estimative probability tasks with icon-array visualizations. Across Arabic, English, French, German, and Mandarin, n = 50 participants per language both chose probability expressions — e.g. likely, probable — to describe icon-array visualizations (Vis-to-Expression), and drew icon-array visualizations to match a given expression (Expression-to-Vis). Results suggest that there is no clear one-to-one mapping of probability expressions and associated visual ranges between languages. Several translated expressions fell significantly above or below the range of the corresponding English expressions. Compared to other languages, French and German respondents appear to exhibit high levels of consistency between the visualizations they drew and the words they chose. Participants across languages used similar words when describing scenarios above 80% chance, with more variance in expressions targeting mid-range and lower values. We discuss how these results suggest potential differences in the expressiveness of language as it relates to visualization interpretation and design goals, as well as practical implications for translation efforts and future studies at the intersection of languages, culture, and visualization. Experiment data, source code, and analysis scripts are available at the following repository: https://osf.io/g5d4r/