LineCap: Line Charts for Data Visualization Captioning Models
Anita Mahinpei, Zona Kostic, Chris Tanner
View presentation:2022-10-19T19:54:00ZGMT-0600Change your timezone on the schedule page
2022-10-19T19:54:00Z
Prerecorded Talk
The live footage of the talk, including the Q&A, can be viewed on the session page, Visualization Systems and Graph Visualization.
Keywords
figure captioning, line charts, deep learning dataset
Abstract
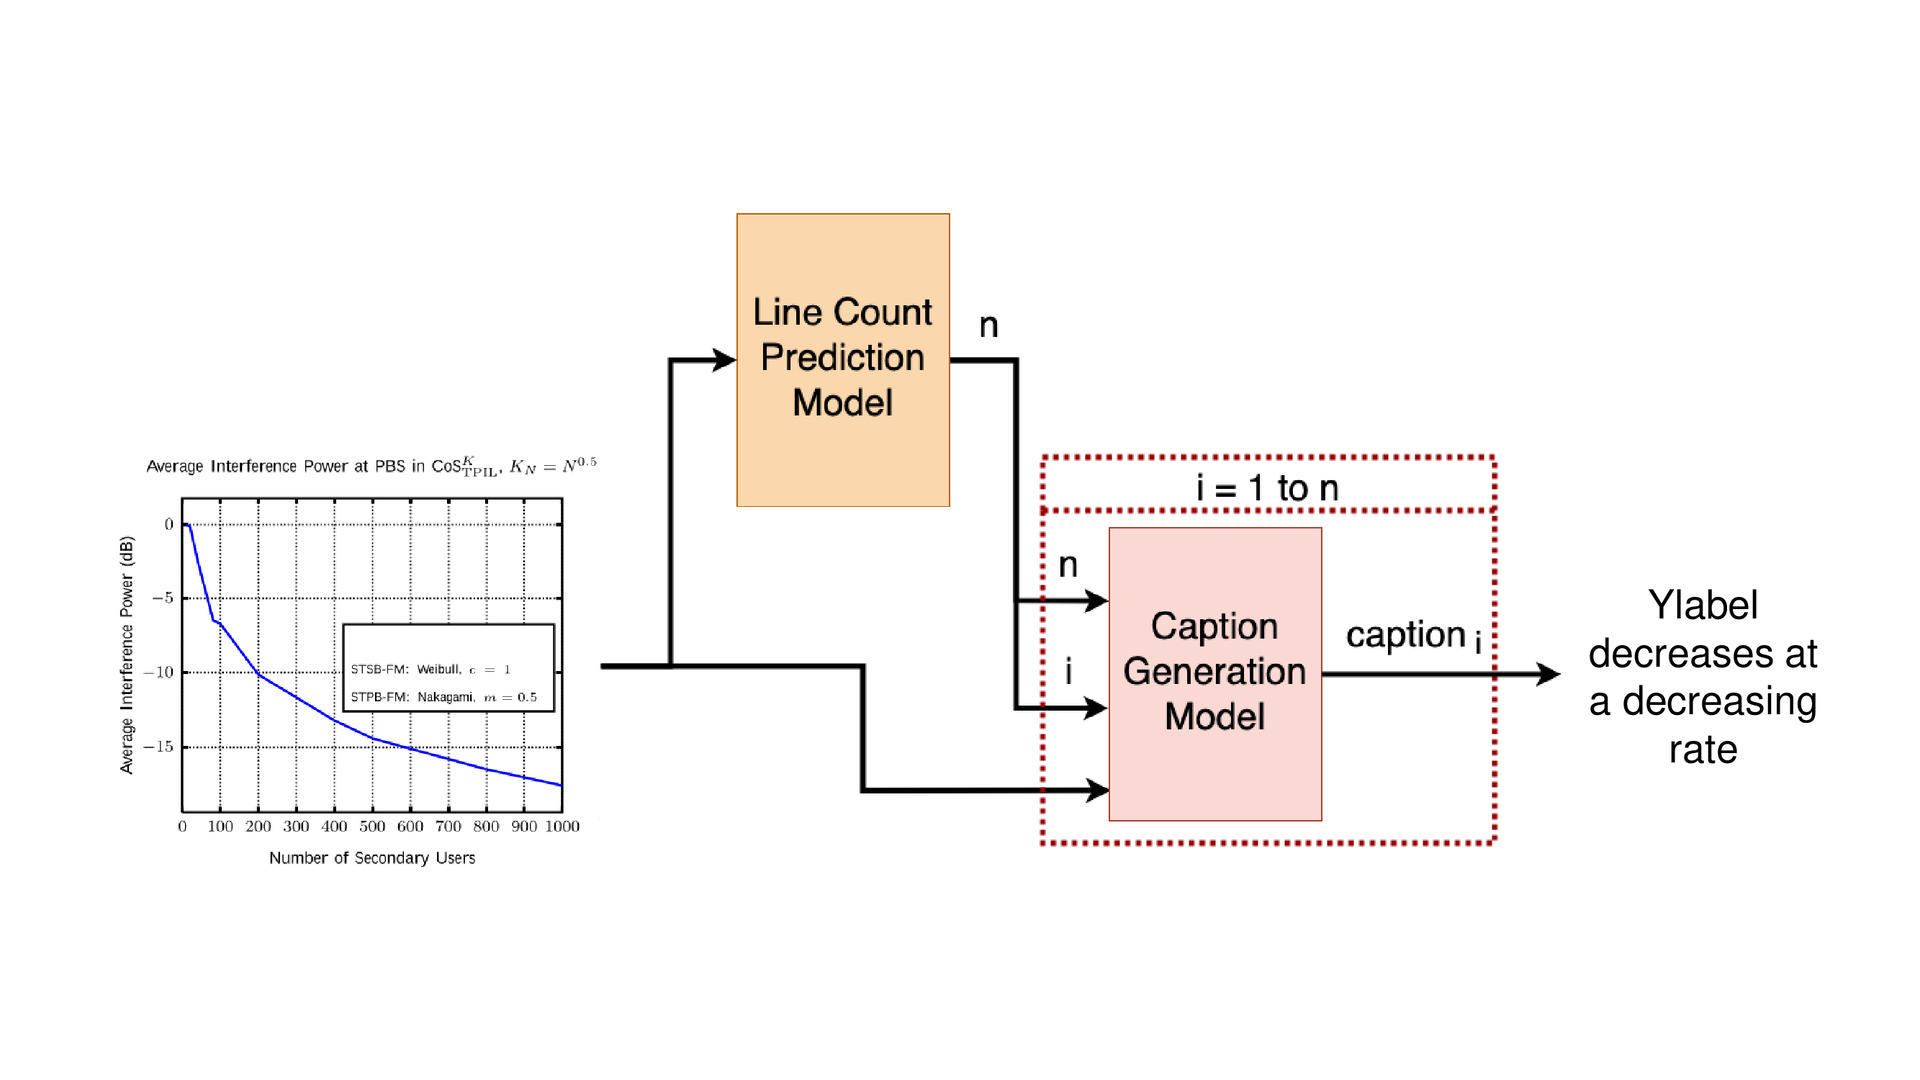
Data visualization captions help readers understand the purpose of a visualization and are crucial for individuals with visual impairments. The prevalence of poor figure captions and the successful application of deep learning approaches to image captioning motivate the use of similar techniques for automated figure captioning. However, research in this field has been stunted by the lack of suitable datasets. We introduce LineCap, a novel figure captioning dataset of 3,528 figures, and we provide insights from curating this dataset and using end-to-end deep learning models for automated figure captioning.