Visualizing Confidence Intervals for Critical Point Probabilities in 2D Scalar Field Ensembles
Dominik Vietinghoff, Michael Böttinger, Gerik Scheuermann, Christian Heine
View presentation:2022-10-20T19:36:00ZGMT-0600Change your timezone on the schedule page
2022-10-20T19:36:00Z
Prerecorded Talk
The live footage of the talk, including the Q&A, can be viewed on the session page, Scientific Visualization, Ensembles, and Accessibility.
Fast forward
Keywords
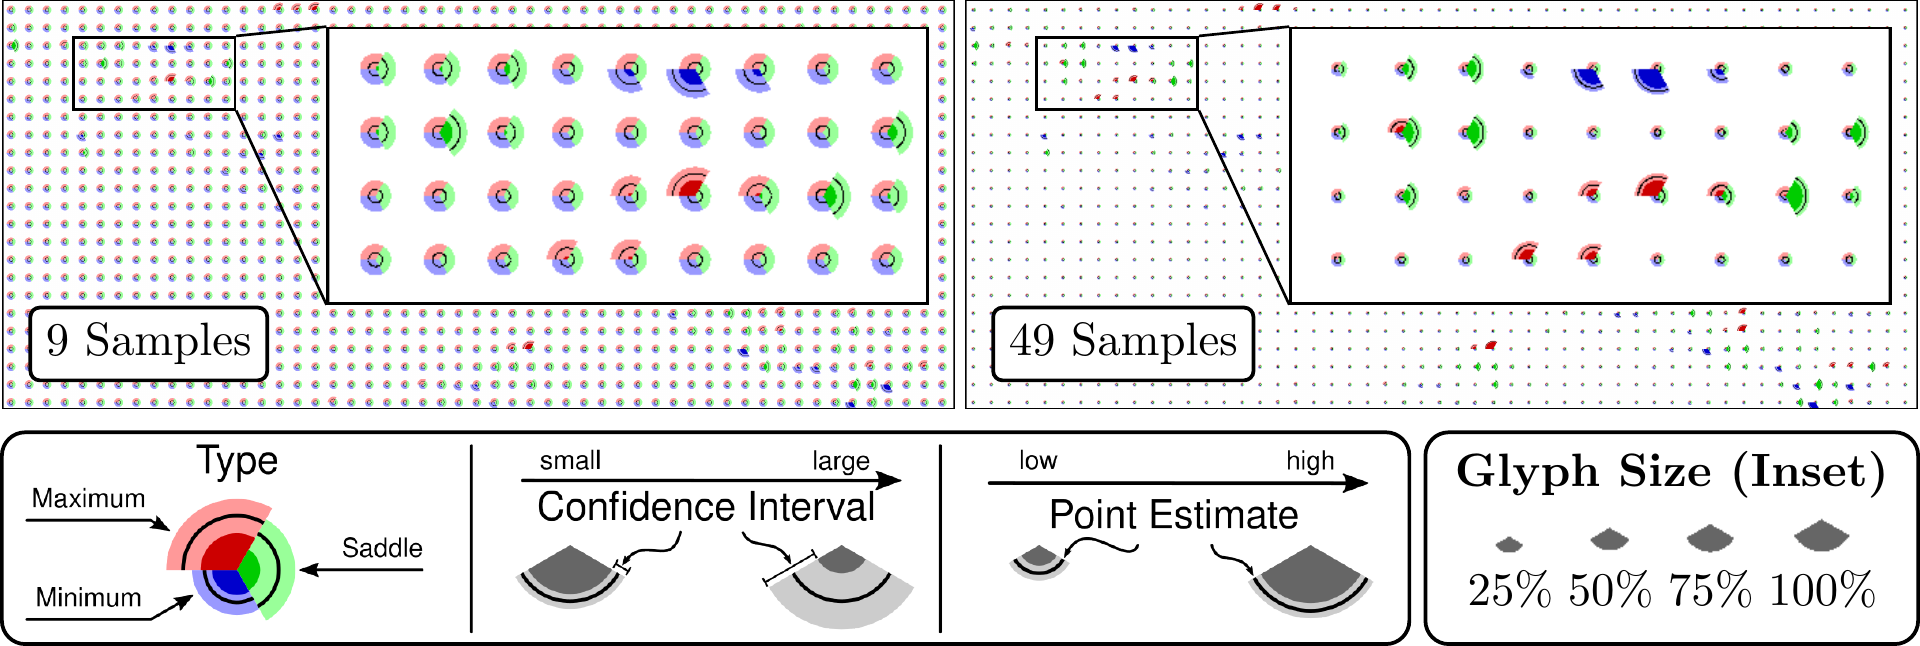
Uncertainty visualization, scalar topology, critical points, ensemble data, climate data, inferential statistics, glyphs.
Abstract
An important task in visualization is the extraction and highlighting of dominant features in data to support users in their analysis process. Topological methods are a well-known means of identifying such features in deterministic fields. However, many real-world phenomena studied today are the result of a chaotic system that cannot be fully described by a single simulation. Instead, the variability of such systems is usually captured with ensemble simulations that produce a variety of possible outcomes of the simulated process. The topological analysis of such ensemble data sets and uncertain data, in general, is less well studied. In this work, we present an approach for the computation and visual representation of confidence intervals for the occurrence probabilities of critical points in ensemble data sets. We demonstrate the added value of our approach over existing methods for critical point prediction in uncertain data on a synthetic data set and show its applicability to a data set from climate research.