Streamlining Visualization Authoring in D3 Through User-Driven Templates
Hannah K. Bako, Alisha Varma, Anuoluwapo Faboro, Mahreen Haider, Favour Nerrise, Bissaka Kenah, Leilani Battle
View presentation:2022-10-19T19:18:00ZGMT-0600Change your timezone on the schedule page
2022-10-19T19:18:00Z

Prerecorded Talk
The live footage of the talk, including the Q&A, can be viewed on the session page, Visualization Systems and Graph Visualization.
Keywords
Human-centered computing—Visualization—Visualization systems and tools—Visualization toolkits;
Abstract
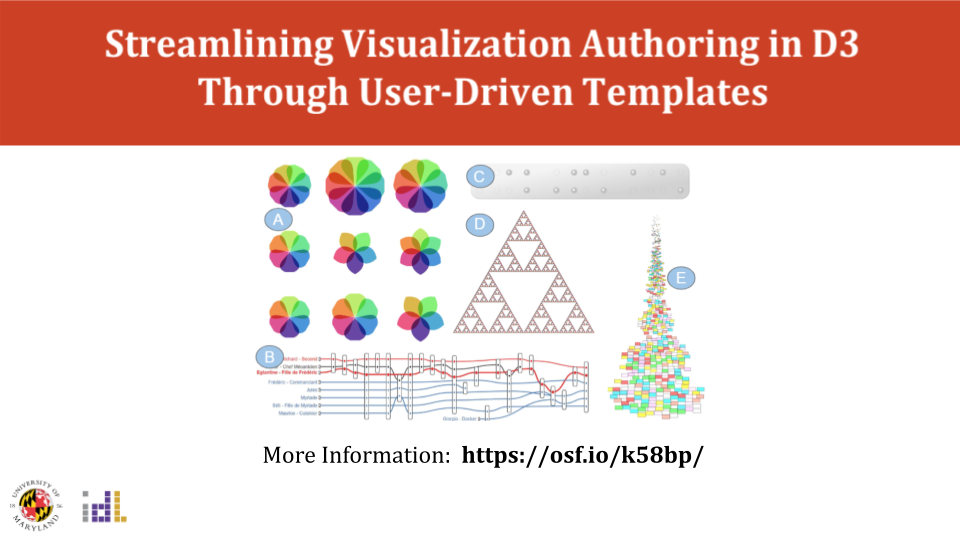
D3 is arguably the most popular tool for implementing web-based visualizations. Yet D3 has a steep learning curve that may hinder its adoption and continued use. To simplify the process of programming D3 visualizations, we must first understand the space of implementation practices that D3 users engage in. We present a qualitative analysis of 2500 D3 visualizations and their corresponding implementations. We find that 5 visualization types (Bar Charts, Geomaps, Line Charts, Scatterplots, and Force Directed Graphs) account for 80% of D3 visualizations found in our corpus. While implementation styles vary slightly across designs, the underlying code structure for all visualization types remains the same; presenting an opportunity for code reuse. Using our corpus of D3 examples, we synthesize reusable code templates for eight popular D3 visualization types and share them in our open source repository. Based on our results, we discuss design considerations for leveraging users’ implementation patterns to reduce visualization design effort through design templates and auto-generated code recommendations.