ASEVis: Visual Exploration of Active System Ensembles to Define Characteristic Measures
Marina Evers, Raphael Wittkowski, Lars Linsen
View presentation:2022-10-20T19:45:00ZGMT-0600Change your timezone on the schedule page
2022-10-20T19:45:00Z
Prerecorded Talk
The live footage of the talk, including the Q&A, can be viewed on the session page, Scientific Visualization, Ensembles, and Accessibility.
Fast forward
Keywords
Physical & Environmental Sciences, Engineering, Mathematics ; Comparison and Similarity ; Coordinated and Multiple Views ; Application Motivated Visualization ; Task Abstractions & Application Domains ; Temporal Data
Abstract
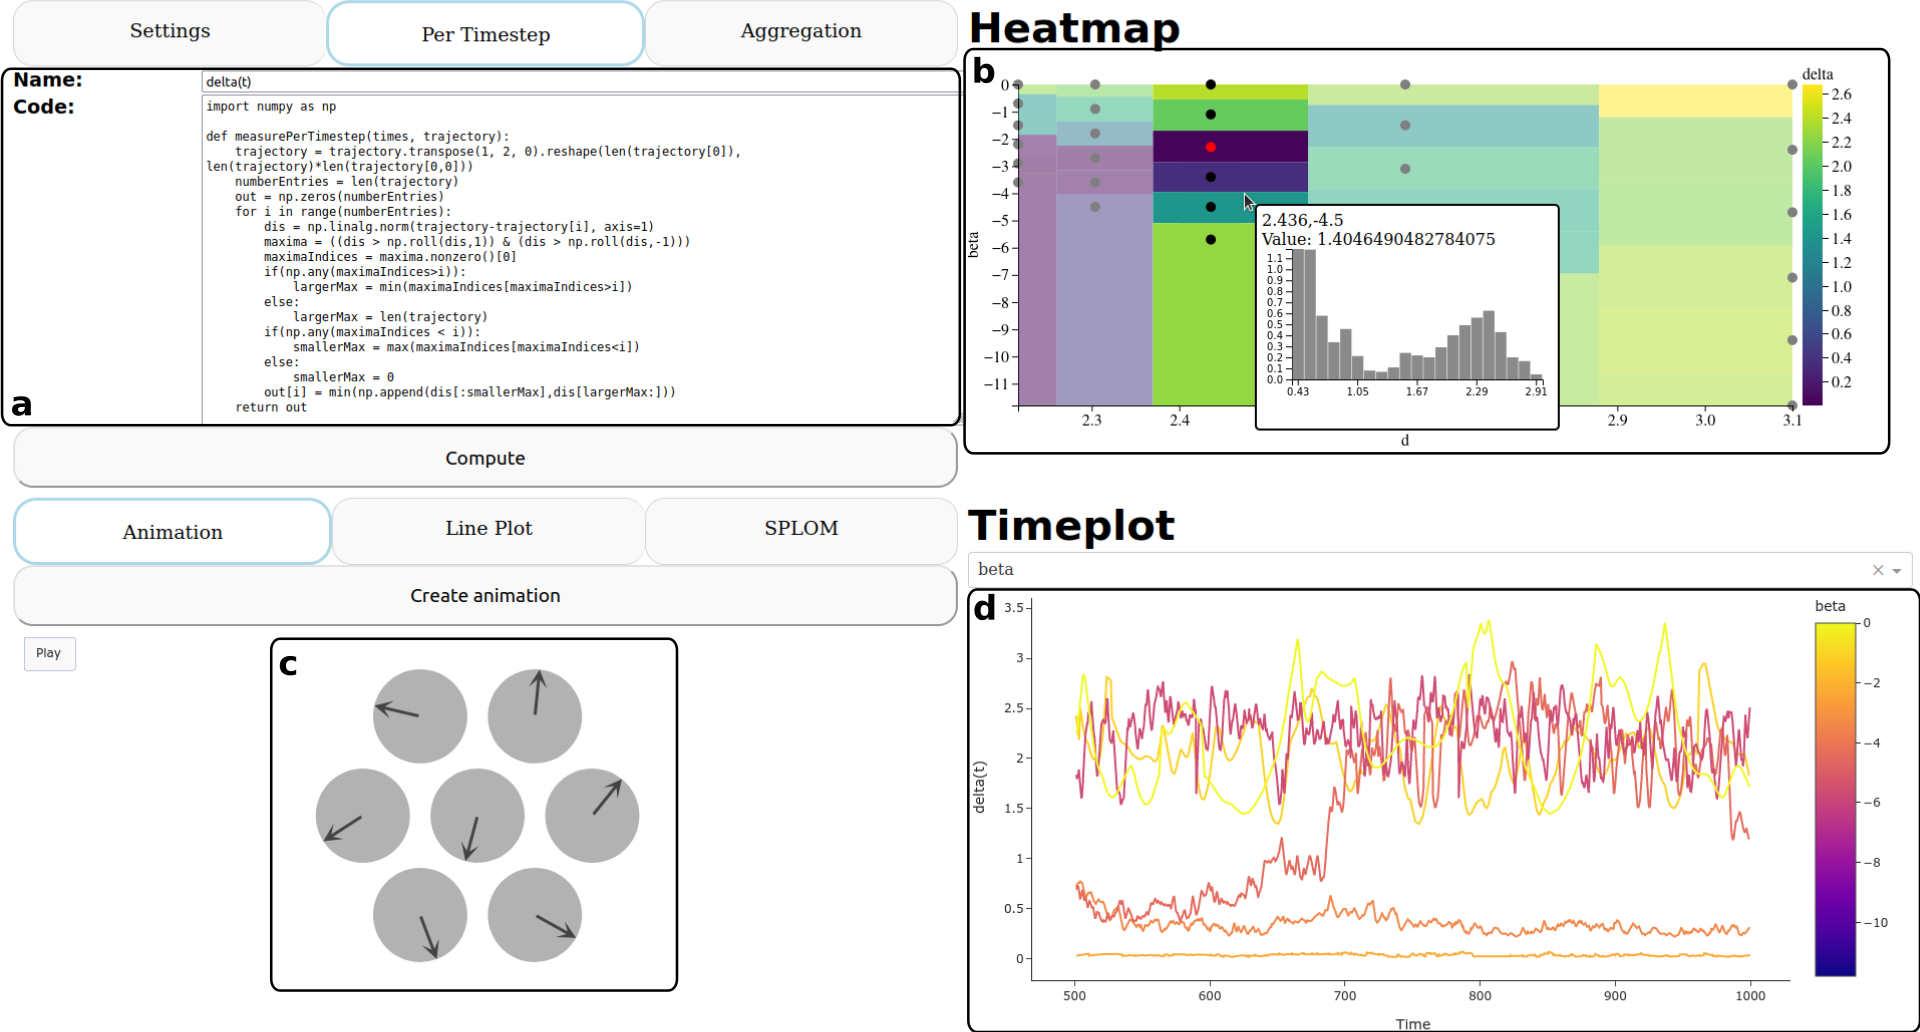
Simulation ensembles are a common tool in physics for understanding how a model outcome depends on input parameters. We analyze an active particle system, where each particle can use energy from its surroundings to propel itself. A multi-dimensional feature vector containing all particles' motion information can describe the whole system at each time step. The system's behavior strongly depends on input parameters like the propulsion mechanism of the particles. To understand how the time-varying behavior depends on the input parameters, it is necessary to introduce new measures to quantify the difference of the dynamics of the ensemble members. We propose a tool that supports the interactive visual analysis of time-varying feature-vector ensembles. A core component of our tool allows for the interactive definition and refinement of new measures that can then be used to understand the system's behavior and compare the ensemble members. Different visualizations support the user in finding a characteristic measure for the system. By visualizing the user-defined measure, the user can then investigate the parameter dependencies and gain insights into the relationship between input parameters and simulation output.