MV2Net: Multi-Variate Multi-View Brain Network Comparison over Uncertain Data
Lei Shi, Junnan Hu, Zhihao Tan, Jun Tao, Jiayan Ding, Yan Jin, Yanjun Wu, Paul M. Thompson
View presentation:2022-10-20T14:00:00ZGMT-0600Change your timezone on the schedule page
2022-10-20T14:00:00Z
Prerecorded Talk
The live footage of the talk, including the Q&A, can be viewed on the session page, Neuro/Brain/Medical Data.
Fast forward
Keywords
brain network, visual comparison, multivariate analysis
Abstract
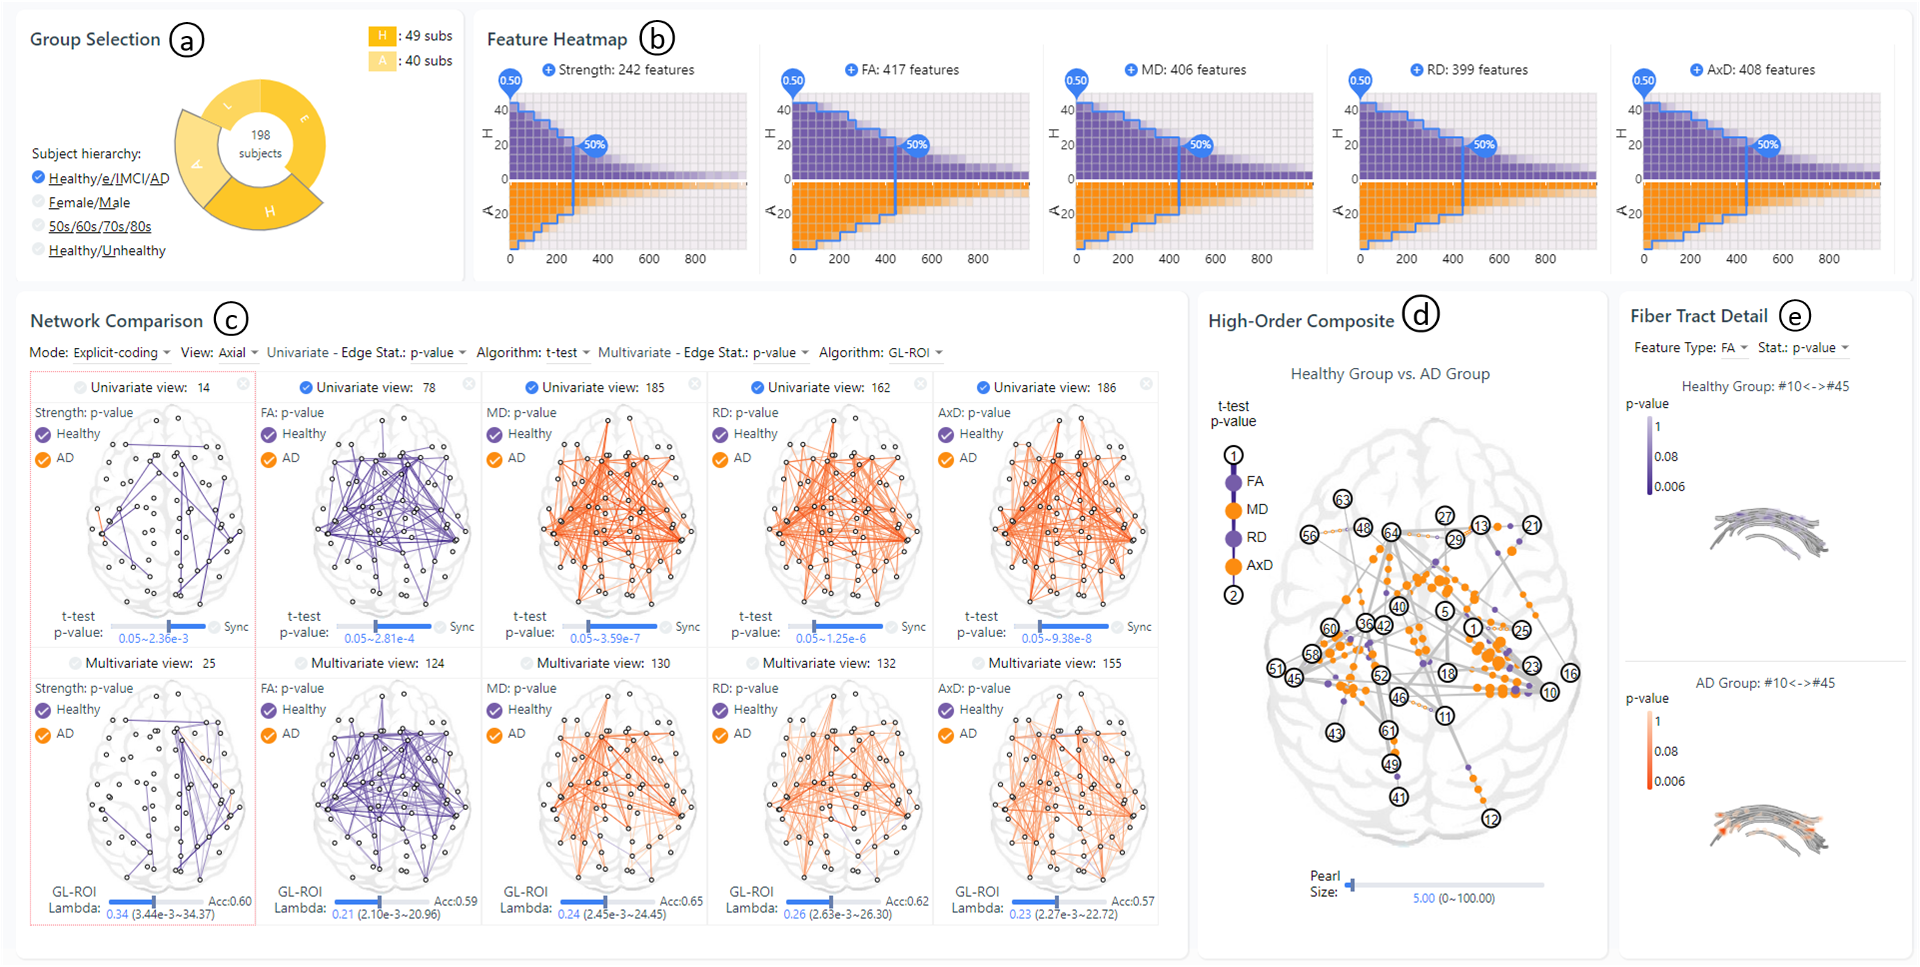
Visually identifying effective bio-markers from human brain networks poses non-trivial challenges to the field of data visualization and analysis. Existing methods in the literature and neuroscience practice are generally limited to the study of individual connectivity features in the brain (e.g., the strength of neural connection among brain regions). Pairwise comparisons between contrasting subject groups (e.g., the diseased and the healthy controls) are normally performed. The underlying neuroimaging and brain network construction process is assumed to have 100% fidelity. Yet, real-world user requirements on brain network visual comparison lean against these assumptions. In this work, we present MV^2Net, a visual analytics system that tightly integrates multi-variate multi-view visualization for brain network comparison with an interactive wrangling mechanism to deal with data uncertainty. On the analysis side, the system integrates multiple extraction methods on diffusion and geometric connectivity features of brain networks, an anomaly detection algorithm for data quality assessment, single- and multi-connection feature selection methods for bio-marker detection. On the visualization side, novel designs are introduced which optimize network comparisons among contrasting subject groups and related connectivity features. Our design provides level-of-detail comparisons, from juxtaposed and explicit-coding views for subject group comparisons, to high-order composite view for correlation of network comparisons, and to fiber tract detail view for voxel-level comparisons. The proposed techniques are inspired and evaluated in expert studies, as well as through case analyses on diffusion and geometric bio-markers of certain neurology diseases. Results in these experiments demonstrate the effectiveness and superiority of MV^2Net over state-of-the-art approaches.