Survey on Visual Analysis of Event Sequence Data
Yi Guo, Shunan Guo, Zhuochen Jin, Smiti Kaul, David Gotz, Nan Cao
View presentation:2022-10-19T14:00:00ZGMT-0600Change your timezone on the schedule page
2022-10-19T14:00:00Z
Prerecorded Talk
The live footage of the talk, including the Q&A, can be viewed on the session page, VA and ML.
Fast forward
Keywords
Visual Analysis, Event Sequence Data, Visualization
Abstract
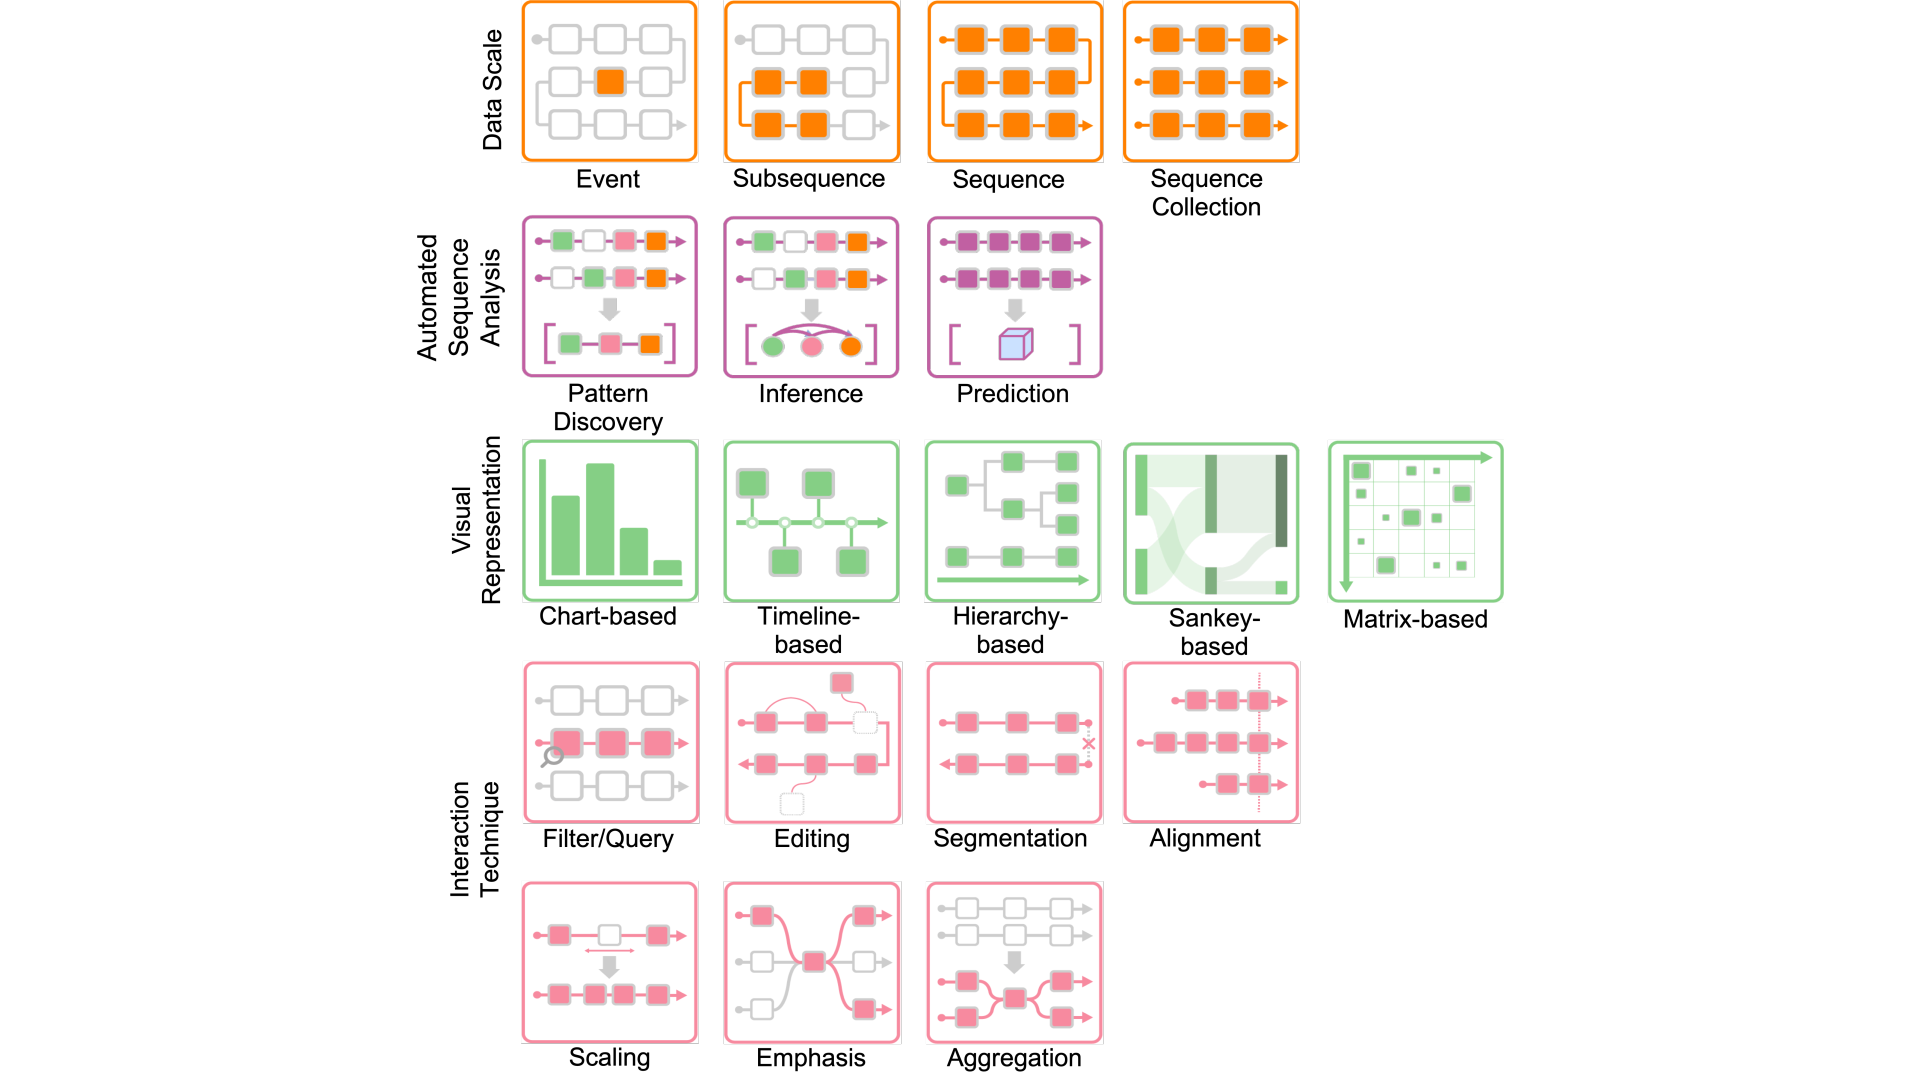
Event sequence data record series of discrete events in the time order of occurrence. They are commonly observed in a variety of applications ranging from electronic health records to network logs, with the characteristics of large-scale, high-dimensional and heterogeneous. This high complexity of event sequence data makes it difficult for analysts to manually explore and find patterns, resulting in ever-increasing needs for computational and perceptual aids from visual analytics techniques to extract and communicate insights from event sequence datasets. In this paper, we review the state-of-the-art visual analytics approaches, characterize them with our proposed design space, and categorize them based on analytical tasks and applications. From our review of relevant literature, we have also identified several remaining research challenges and future research opportunities.