Effectiveness Error: Measuring and Improving RadViz Visual Effectiveness
Marco Angelini, Graziano Blasilli, Simone Lenti, Alessia Palleschi, Giuseppe Santucci
View presentation:2022-10-19T21:45:00ZGMT-0600Change your timezone on the schedule page
2022-10-19T21:45:00Z
Prerecorded Talk
The live footage of the talk, including the Q&A, can be viewed on the session page, Dealing with Scale, Space, and Dimension.
Fast forward
Keywords
Dimensionality reduction, RadViz, dimension arrangement, visual quality metrics.
Abstract
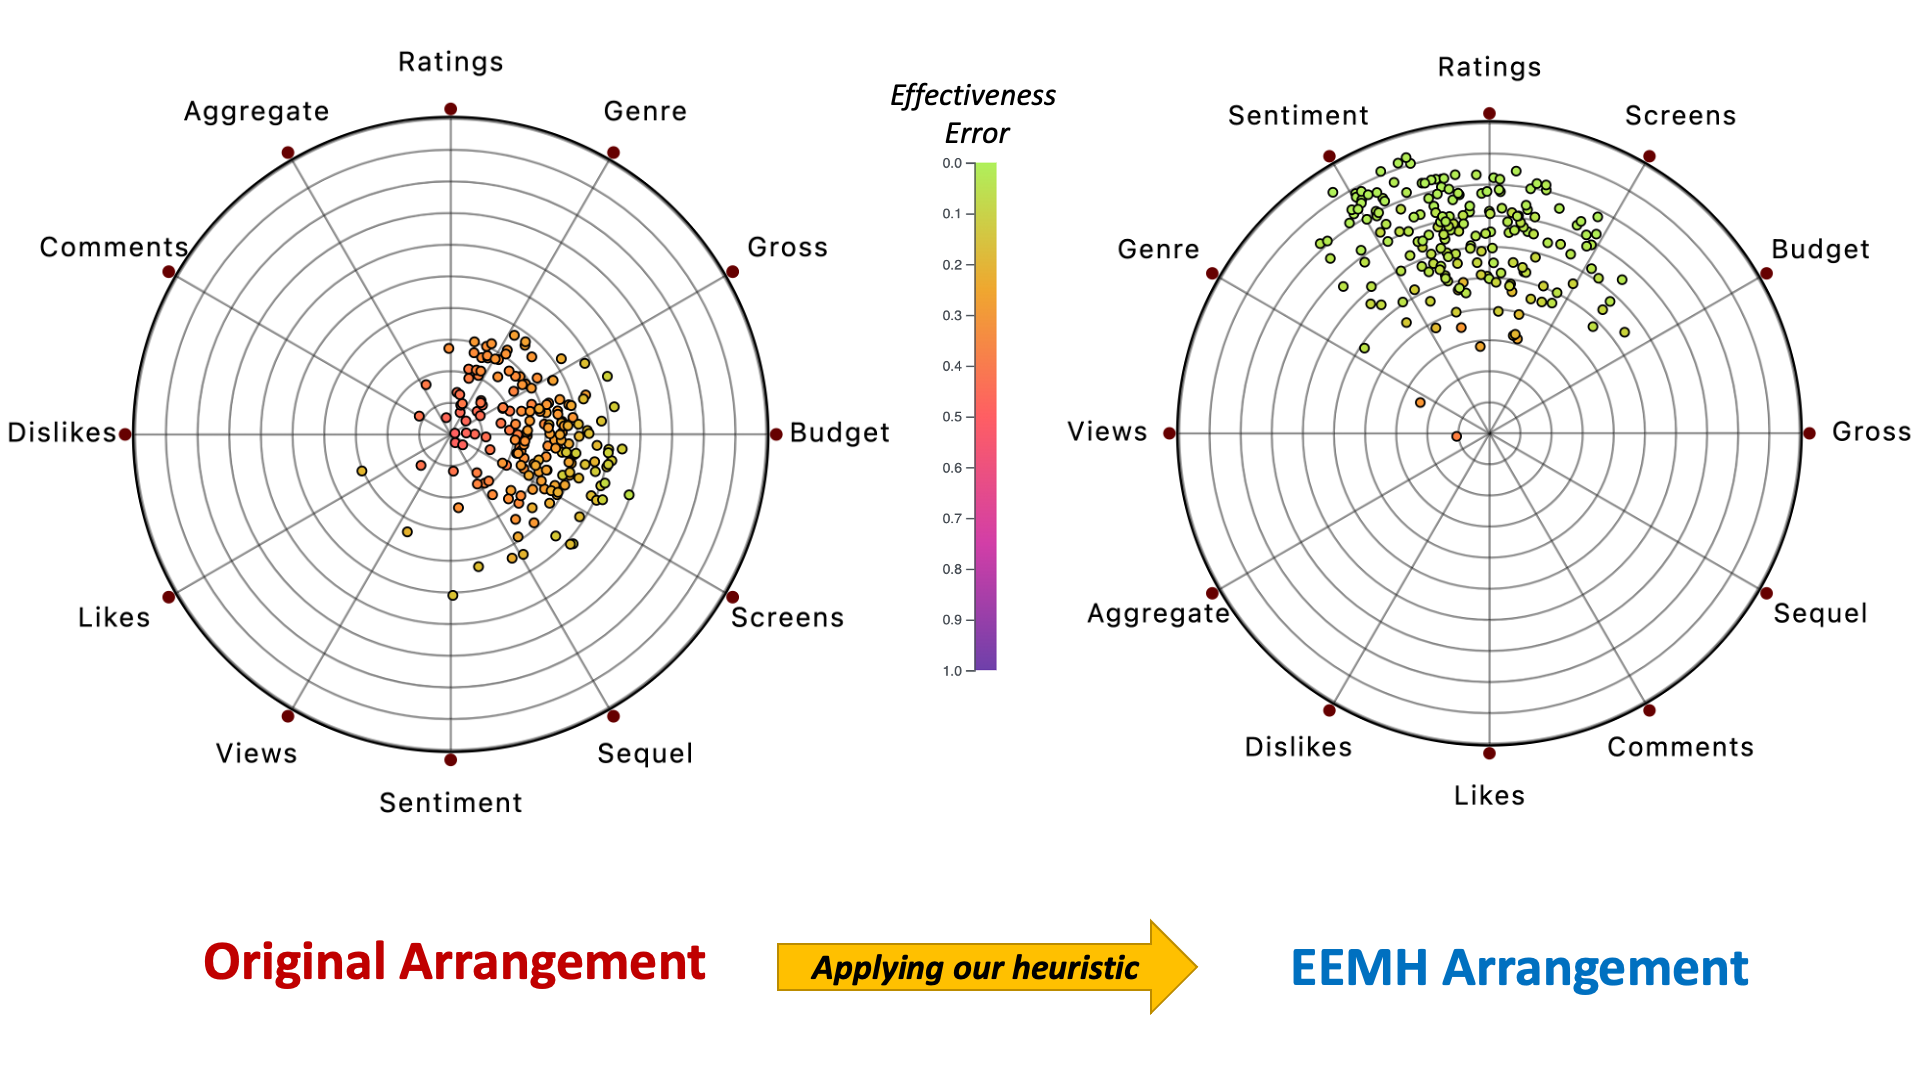
RadViz contributes to multidimensional analysis by using 2D points for encoding data elements and interpreting them alongthe original data dimensions. For these characteristics it is used in different application domains, like clustering, anomaly detection, and software visualization. However, it is likely that using the dimension arrangement that comes with the data will produce a plot that leads users to make inaccurate conclusions about points values and data distribution. This paper attacks this problem without altering the original RadViz design: it defines, for both a single point and a set of points, the metric of effectiveness error, and uses it to define the objective function of a dimension arrangement strategy, arguing that minimizing it increases the overall RadViz visual quality. This paper investigated the intuition that reducing the effectiveness error is beneficial for other well-known RadViz problems, like points clumping toward the center, many-to-one plotting of non-proportional points, and cluster separation. It presents an algorithm that reduces to zero the effectiveness error for a single point and a heuristic that approximates the dimension arrangement minimizing the effectiveness error for an arbitrary set of points. A set of experiments based on 21 real datasets has been performed, with the goals of analyzing the advantages of reducing the effectiveness error, comparing the proposed dimension arrangement strategy with other related proposals, and investigating the heuristic accuracy. The Effectiveness Error metric, the algorithm, and the heuristic presented in this paper have been made available in a d3.jsplugin at https://aware-diag-sapienza.github.io/d3-radviz.