Provectories: Embedding-based Analysis of Interaction Provenance Data
Conny Walchshofer, Andreas Hinterreiter, Kai Xu, Holger Stitz, Marc Streit
View presentation:2022-10-20T21:09:00ZGMT-0600Change your timezone on the schedule page
2022-10-20T21:09:00Z
Prerecorded Talk
The live footage of the talk, including the Q&A, can be viewed on the session page, Provenance and Guidance.
Fast forward
Keywords
Visualization techniques, Information visualization, Visual analytics, Interaction Provenance, Sensemaking
Abstract
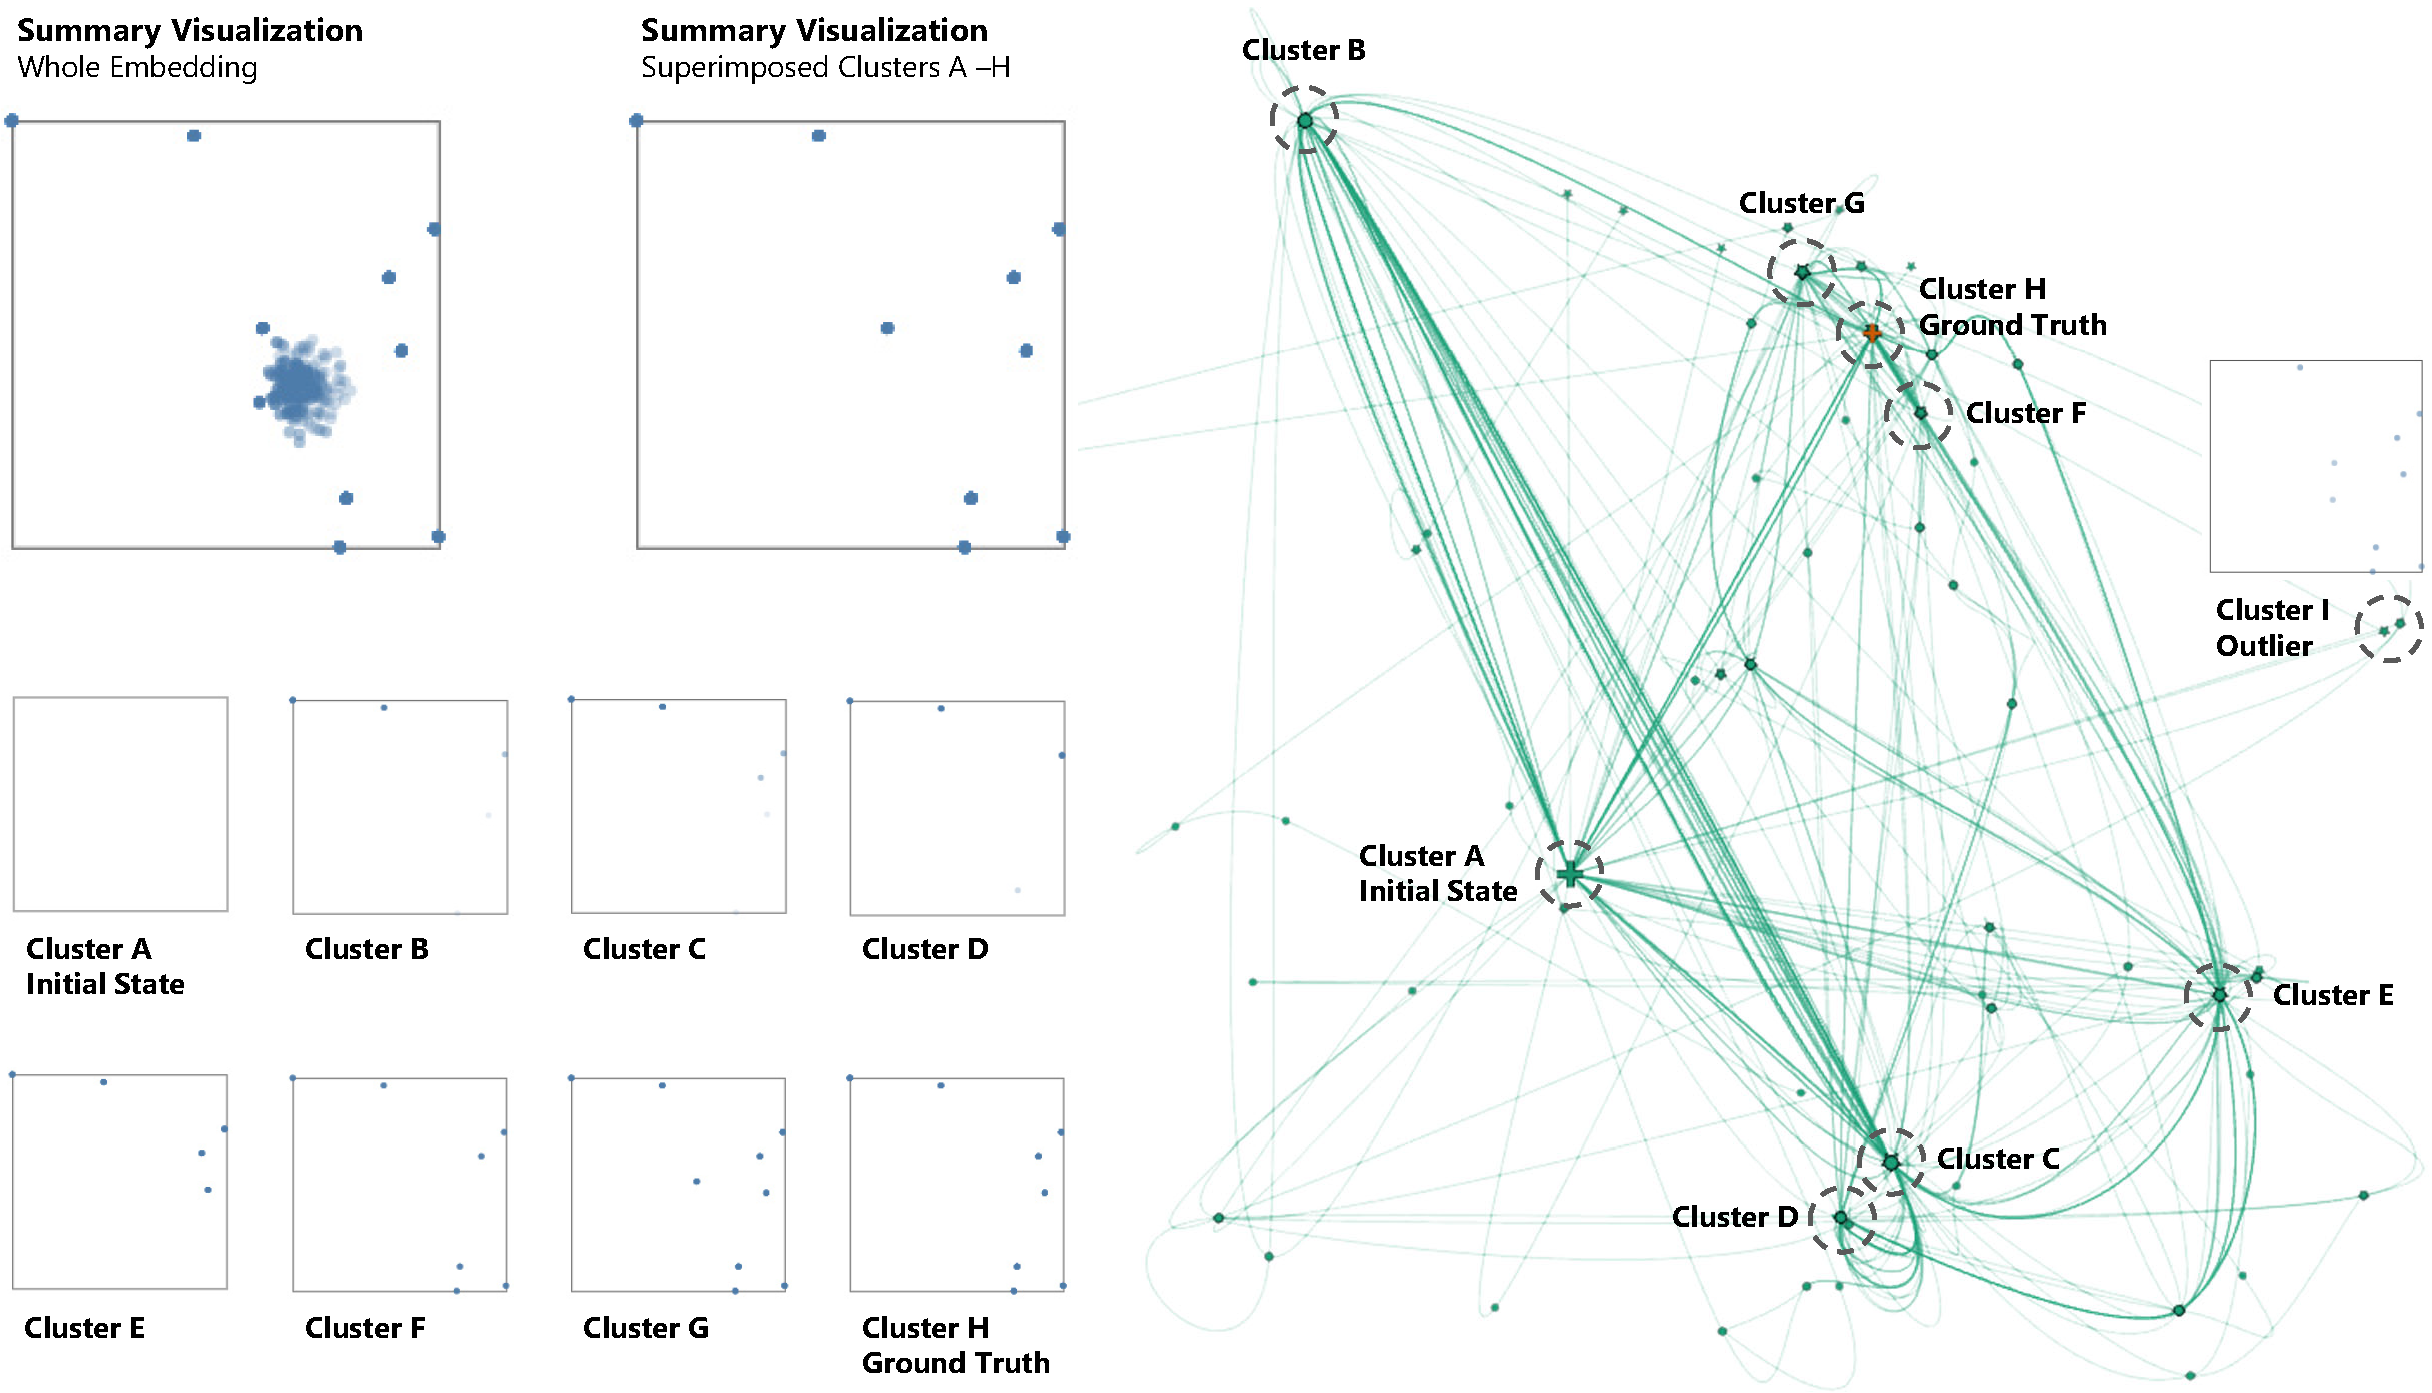
Understanding user behavior patterns and visual analysis strategies is a long-standing challenge. Existing approaches rely largely on time-consuming manual processes such as interviews and the analysis of observational data. While it is technically possible to capture a history of user interactions and application states, it remains difficult to extract and describe analysis strategies based on interaction provenance. In this paper, we propose a novel visual approach to the meta-analysis of interaction provenance. We capture single and multiple user sessions as graphs of high-dimensional application states. Our meta-analysis is based on two different types of two-dimensional embeddings of these high-dimensional states: layouts based on (i) topology and (ii) attribute similarity. We applied these visualization approaches to synthetic and real user provenance data captured in two user studies. From our visualizations, we were able to extract patterns for data types and analytical reasoning strategies.