A Predictive Visual Analytics System for Studying Neurodegenerative Disease Based on DTI Fiber Tracts
Chaoqing Xu, Tyson Neuroth, Takanori Fujiwara, Ronghua Liang, Kwan-Liu Ma
View presentation:2022-10-20T14:36:00ZGMT-0600Change your timezone on the schedule page
2022-10-20T14:36:00Z
Prerecorded Talk
The live footage of the talk, including the Q&A, can be viewed on the session page, Neuro/Brain/Medical Data.
Fast forward
Keywords
Brain fiber tracts, neurodegenerative disease, machine learning, predictive visual analytics, visualization.
Abstract
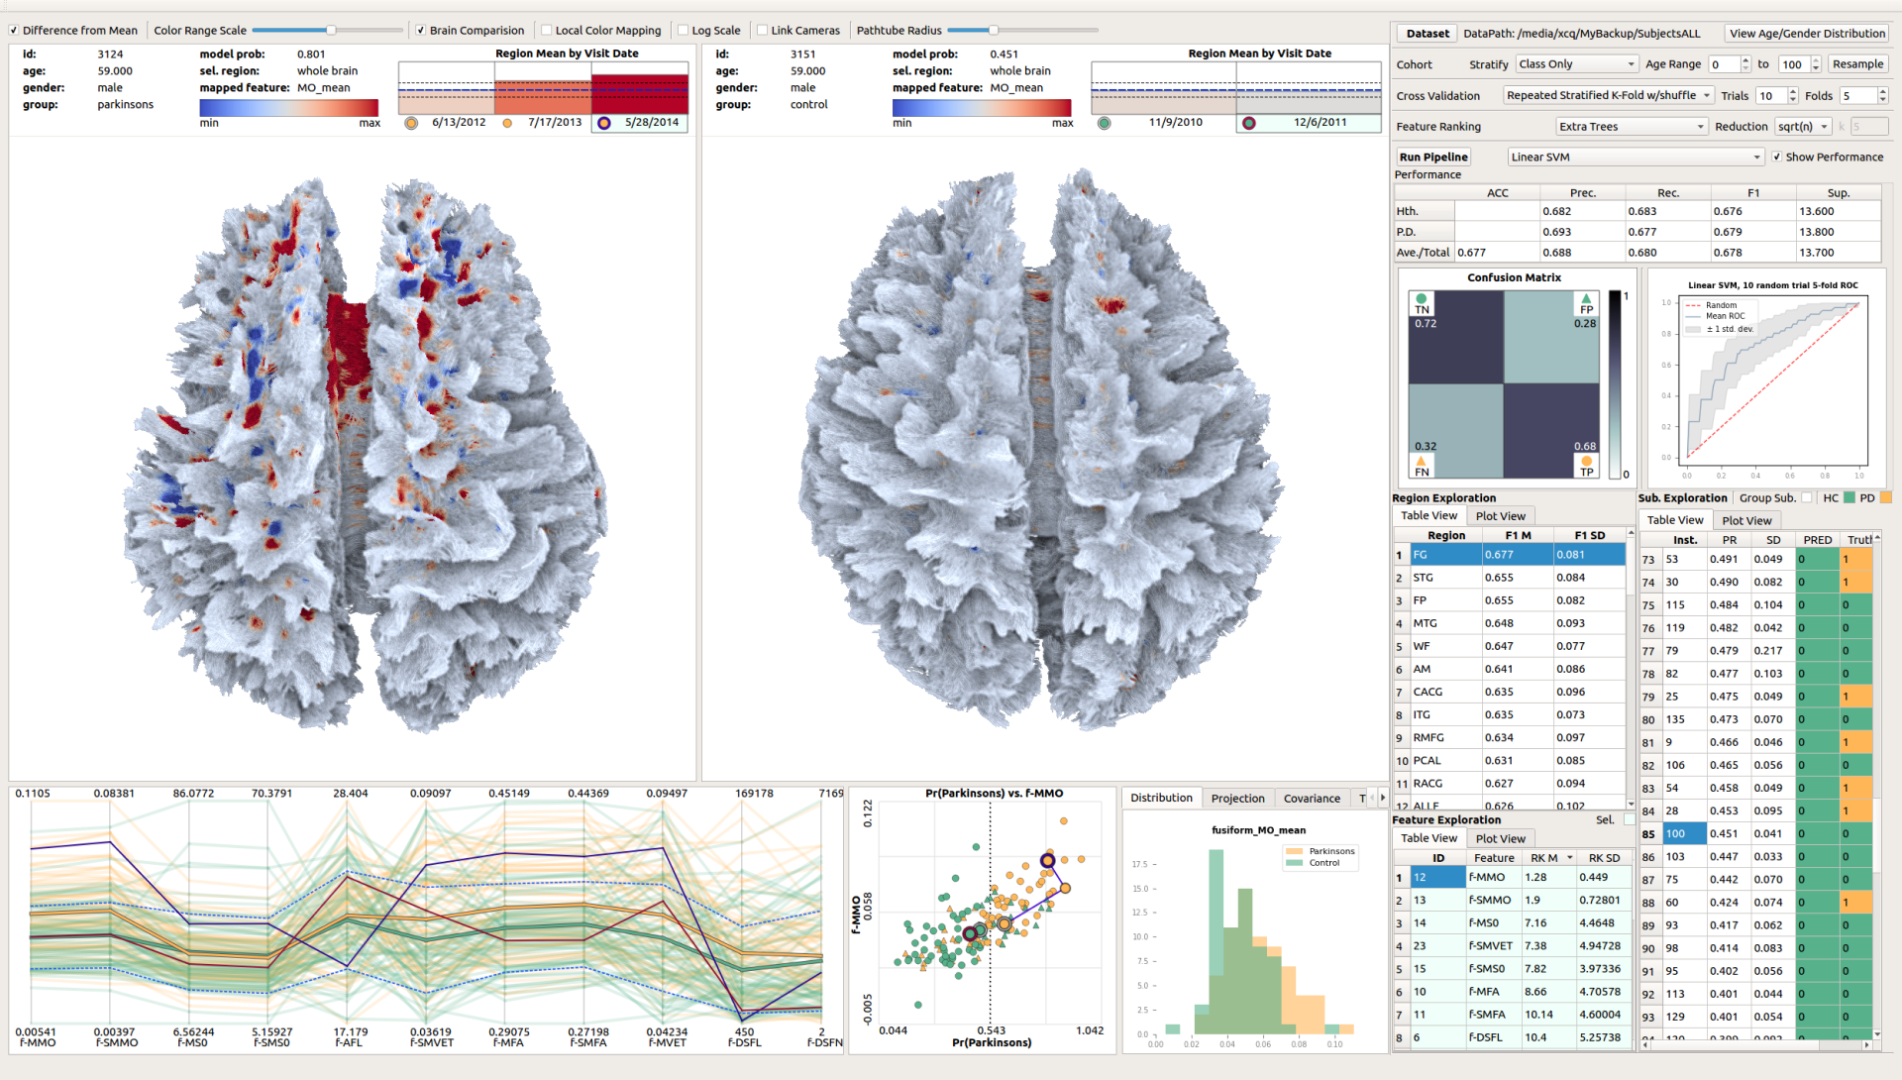
Diffusion tensor imaging (DTI) has been used to study the effects of neurodegenerative diseases on neural pathways, which may lead to more reliable and early diagnosis of these diseases as well as a better understanding of how they affect the brain. We introduce a predictive visual analytics system for studying patient groups based on their labeled DTI fiber tract data and corresponding statistics. The system’s machine-learning-augmented interface guides the user through an organized and holistic analysis space, including the statistical feature space, the physical space, and the space of patients over different groups. We use a custom machine learning pipeline to help narrow down this large analysis space and then explore it pragmatically through a range of linked visualizations. We conduct several case studies using DTI and T1-weighted images from the research database of Parkinson’s Progression Markers Initiative.