GNNLens: A Visual Analytics Approach for Prediction Error Diagnosis of Graph Neural Networks
Zhihua Jin, Yong Wang, Qianwen Wang, Yao Ming, Tengfei Ma, Huamin Qu
View presentation:2022-10-19T15:45:00ZGMT-0600Change your timezone on the schedule page
2022-10-19T15:45:00Z
Prerecorded Talk
The live footage of the talk, including the Q&A, can be viewed on the session page, VA for ML.
Fast forward
Keywords
Graph Neural Networks, Error Diagnosis, Visualization
Abstract
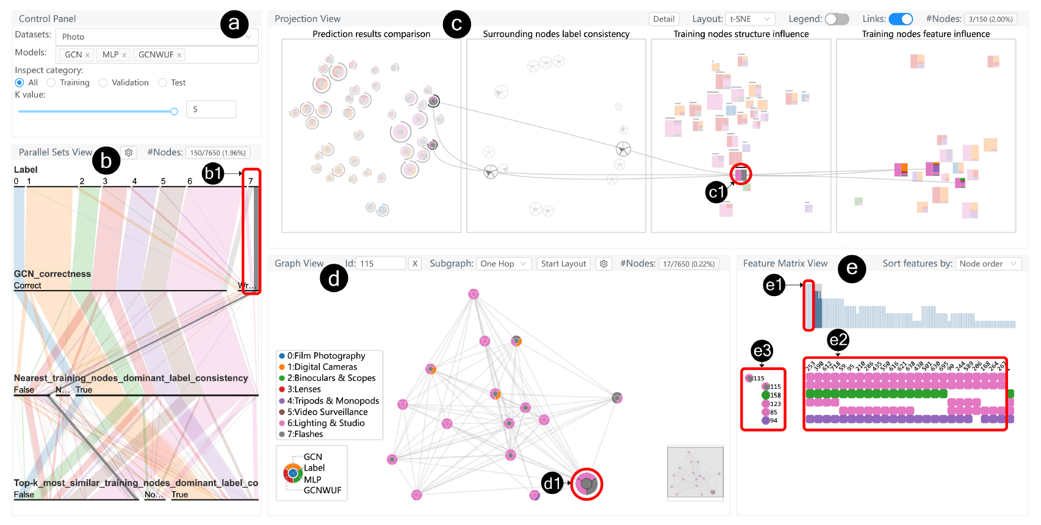
Graph Neural Networks (GNNs) aim to extend deep learning techniques to graph data and have achieved significant progress in graph analysis tasks (e.g., node classification) in recent years. However, similar to other deep neural networks like Convolutional Neural Networks (CNNs) and Recurrent Neural Networks (RNNs), GNNs behave like a black box with their details hidden from model developers and users. It is therefore difficult to diagnose possible errors of GNNs. Despite many visual analytics studies being done on CNNs and RNNs, little research has addressed the challenges for GNNs. This paper fills the research gap with an interactive visual analysis tool, GNNLens, to assist model developers and users in understanding and analyzing GNNs. Specifically, Parallel Sets View and Projection View enable users to quickly identify and validate error patterns in the set of wrong predictions; Graph View and Feature Matrix View offer a detailed analysis of individual nodes to assist users in forming hypotheses about the error patterns. Since GNNs jointly model the graph structure and the node features, we reveal the relative influences of the two types of information by comparing the predictions of three models: GNN, Multi-Layer Perceptron (MLP), and GNN Without Using Features (GNNWUF). Two case studies and interviews with domain experts demonstrate the effectiveness of GNNLens in facilitating the understanding of GNN models and their errors.