Visual Exploration of Relationships and Structure in Low-Dimensional Embeddings
Klaus Eckelt, Andreas Hinterreiter, Patrick Adelberger, Conny Walchshofer, Vaishali Dhanoa, Christina Humer, Moritz Heckmann, Christian A. Steinparz, Marc Streit
View presentation:2022-10-21T14:36:00ZGMT-0600Change your timezone on the schedule page
2022-10-21T14:36:00Z
Prerecorded Talk
The live footage of the talk, including the Q&A, can be viewed on the session page, Comparisons.
Fast forward
Keywords
Dimensionality reduction, projection, visual analytics, layout enrichment, aggregation, comparison
Abstract
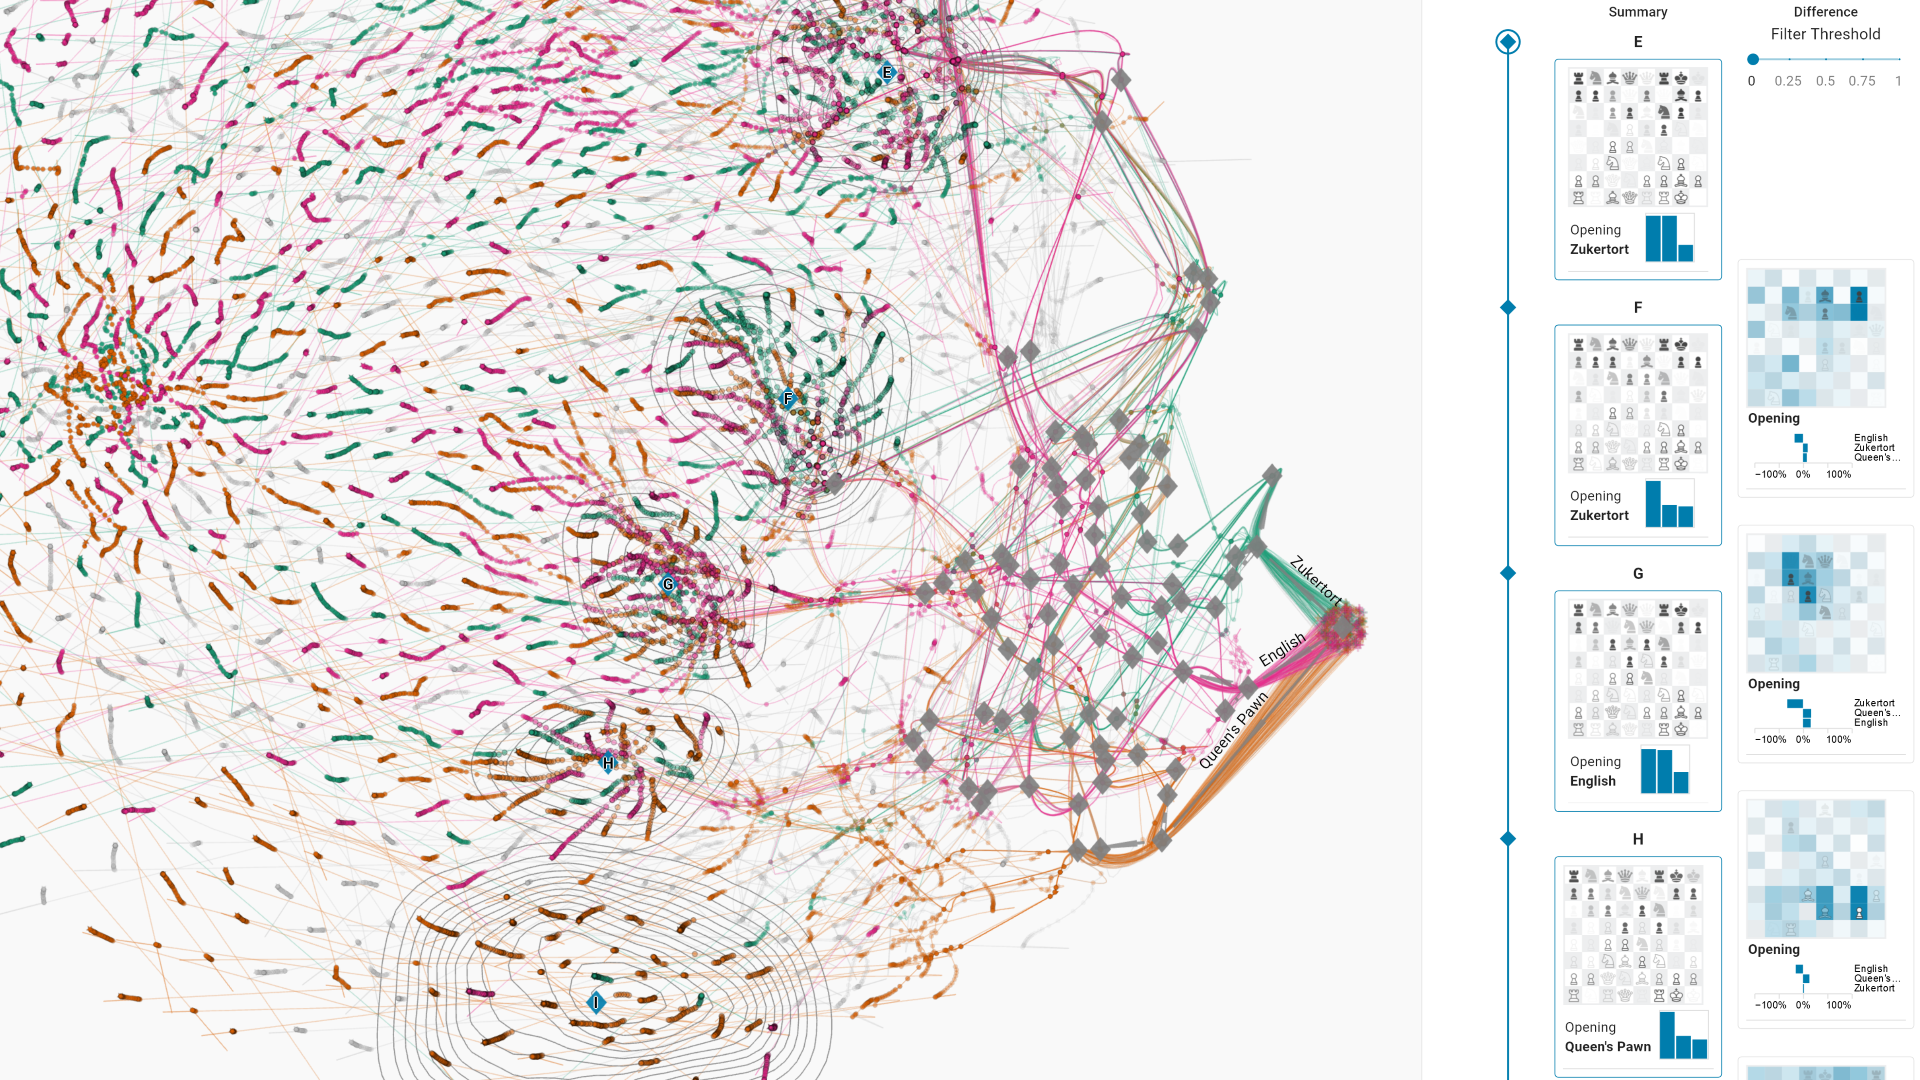
In this work, we propose an interactive visual approach for the exploration and formation of structural relationships in embeddings of high-dimensional data. These structural relationships, such as item sequences, associations of items with groups, and hierarchies between groups of items, are defining properties of many real-world datasets. Nevertheless, most existing methods for the visual exploration of embeddings treat these structures as second-class citizens or do not take them into account at all. In our proposed analysis workflow, users explore enriched scatterplots of the embedding, in which relationships between items and\slash or groups are visually highlighted. The original high-dimensional data for single items, groups of items, or differences between connected items and groups are accessible through additional summary visualizations. We carefully tailored these summary and difference visualizations to the various data types and semantic contexts. During their exploratory analysis, users can externalize their insights by setting up additional groups and relationships between items and\slash or groups. We demonstrate the utility and potential impact of our approach by means of two use cases and multiple examples from various domains.