EpiMob: Interactive Visual Analytics of Citywide Human Mobility Restrictions for Epidemic Control
Chuang Yang, Zhiwen Zhang, Zipei Fan, Renhe Jiang, Quanjun Chen, Xuan Song, Ryosuke Shibasaki.
View presentation:2022-10-21T14:48:00ZGMT-0600Change your timezone on the schedule page
2022-10-21T14:48:00Z
Prerecorded Talk
The live footage of the talk, including the Q&A, can be viewed on the session page, Spatial Data.
Fast forward
Keywords
Human mobility simulation, epidemic control, visual analytics, interactive system, big trajectory data
Abstract
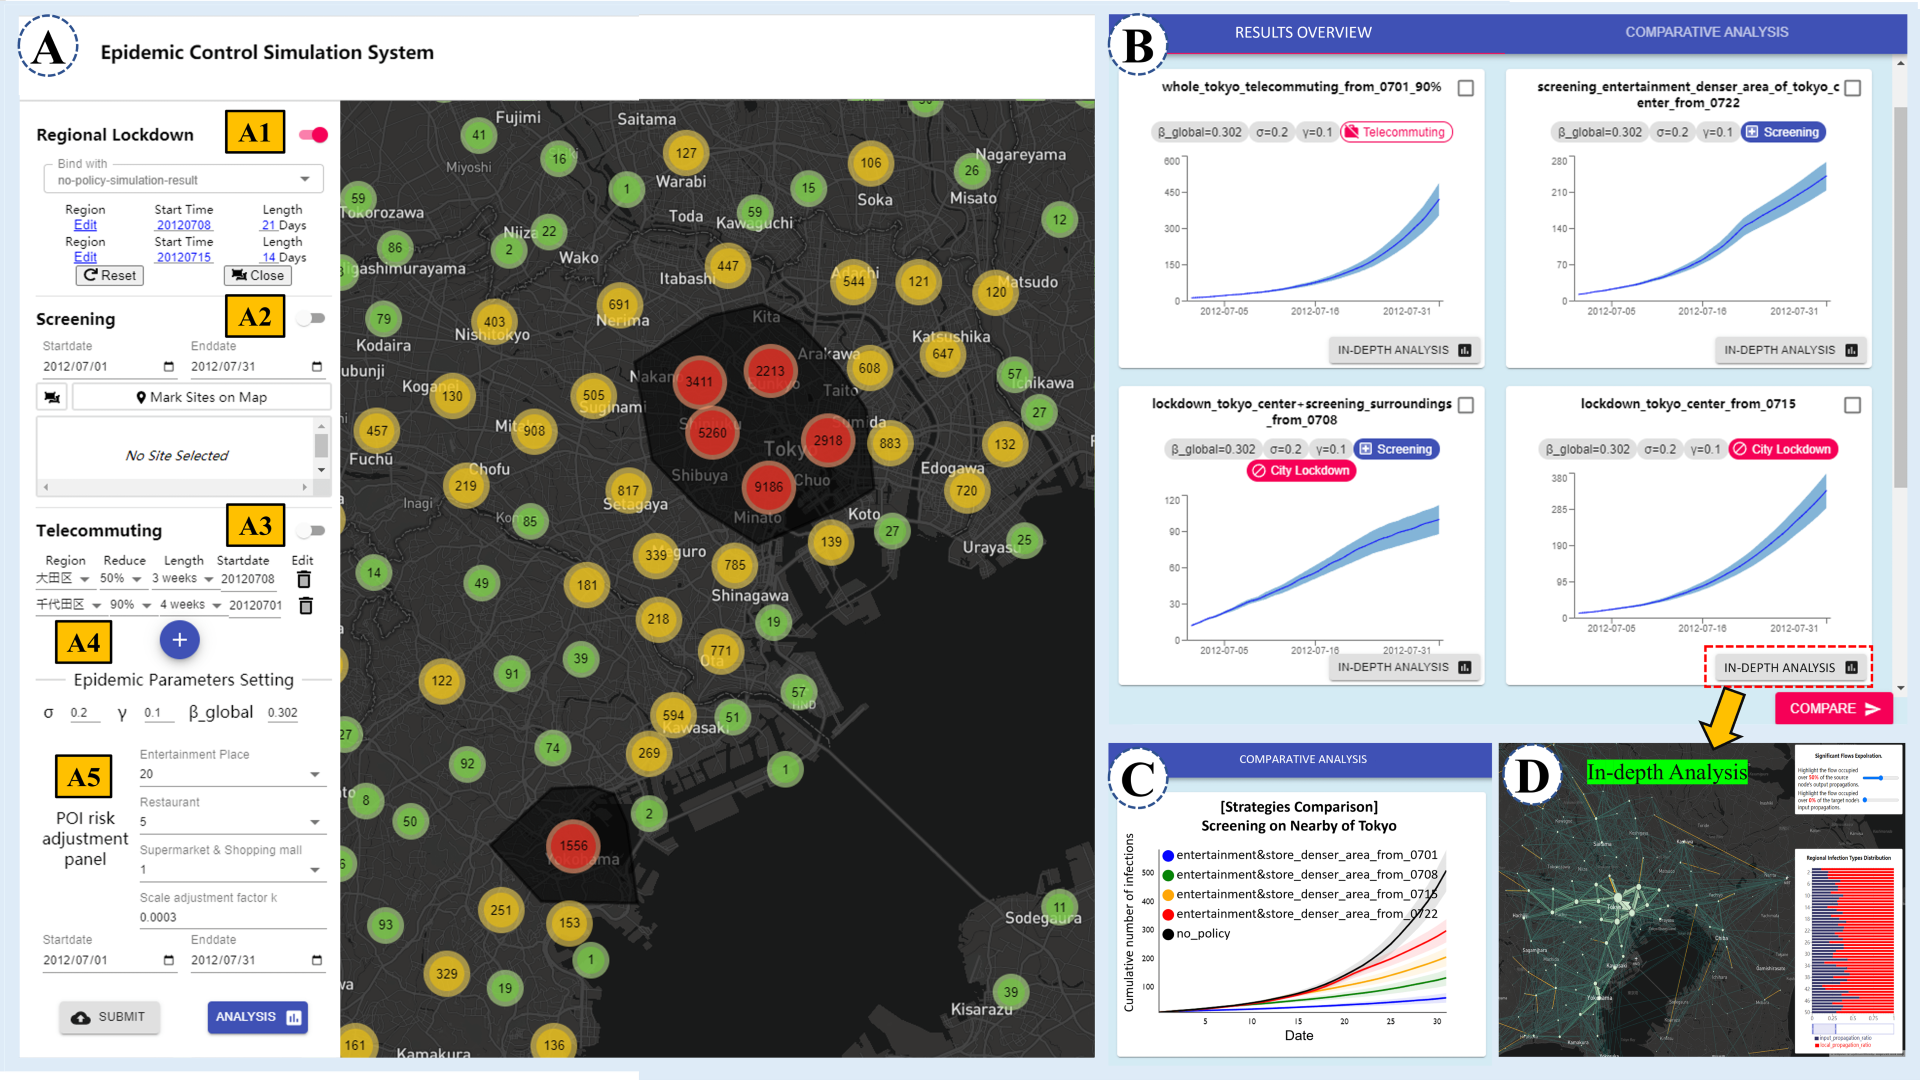
The outbreak of coronavirus disease (COVID-19) has swept across more than 180 countries and territories since late January 2020. As a worldwide emergency response, governments have implemented various measures and policies, such as self-quarantine, travel restrictions, work from home, and regional lockdown, to control the spread of the epidemic. These countermeasures seek to restrict human mobility because COVID-19 is a highly contagious disease that is spread by human-to-human transmission. Medical experts and policymakers have expressed the urgency to effectively evaluate the outcome of human restriction policies with the aid of big data and information technology. Thus, based on big human mobility data and city POI data, an interactive visual analytics system called Epidemic Mobility (EpiMob) was designed in this study. The system interactively simulates the changes in human mobility and infection status in response to the implementation of a certain restriction policy or a combination of policies (e.g., regional lockdown, telecommuting, screening). Users can conveniently designate the spatial and temporal ranges for different mobility restriction policies. Then, the results reflecting the infection situation under different policies are dynamically displayed and can be flexibly compared and analyzed in depth. Multiple case studies consisting of interviews with domain experts were conducted in the largest metropolitan area of Japan (i.e., Greater Tokyo Area) to demonstrate that the system can provide insight into the effects of different human mobility restriction policies for epidemic control, through measurements and comparisons.