ClinicalPath: a Visualization tool to Improve the Evaluation of Electronic Health Records in Clinical Decision-Making
Claudio D. G. Linhares, Daniel M. Lima, Jean R. Ponciano, Mauro M. Olivatto, Marco A. Gutierrez, Jorge Poco, Caetano Traina Jr., Agma J. M. Traina
View presentation:2022-10-21T14:00:00ZGMT-0600Change your timezone on the schedule page
2022-10-21T14:00:00Z
Prerecorded Talk
The live footage of the talk, including the Q&A, can be viewed on the session page, Visual Analytics of Health Data.
Fast forward
Keywords
Information Visualization, Interactive Visualizations, Human-Computer Interaction, Electronic Health Records
Abstract
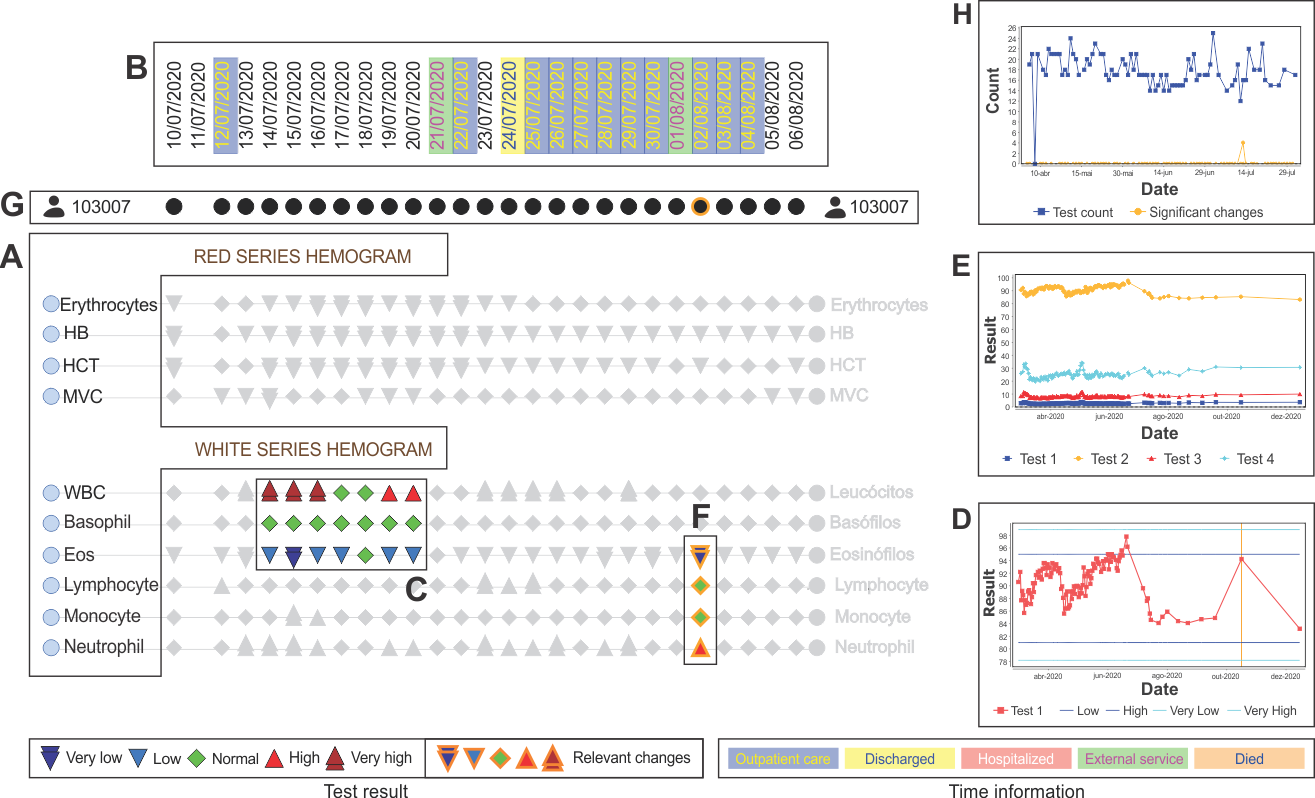
Physicians work at a very tight schedule and need decision-making support tools to help on improving and doing their work in a timely and dependable manner. Examining piles of sheets with test results and using systems with little visualization support to provide diagnostics is daunting, but that is still the usual way for the physicians' daily procedure, especially in developing countries. Electronic Health Records systems have been designed to keep the patients' history and reduce the time spent analyzing the patient's data. However, better tools to support decision-making are still needed. In this paper, we propose \systemname, a visualization tool for users to track a patient's clinical path through a series of tests and data, which can aid in treatments and diagnoses. Our proposal is focused on patient's data analysis, presenting the test results and clinical history longitudinally. Both the visualization design and the system functionality were developed in close collaboration with experts in the medical domain to ensure a right fit of the technical solutions and the real needs of the professionals. We validated the proposed visualization based on case studies and user assessments through tasks based on the physician's daily activities. Our results show that our proposed system improves the physicians' experience in decision-making tasks, made with more confidence and better usage of the physicians' time, allowing them to take other needed care for the patients.