Power Overwhelming: Quantifying the Energy Cost of Visualisation
Christoph Müller, Moritz Heinemann, Daniel Weiskopf, Thomas Ertl
View presentation:2022-10-17T20:00:00ZGMT-0600Change your timezone on the schedule page
2022-10-17T20:00:00Z
The live footage of the talk, including the Q&A, can be viewed on the session page, BELIV: Paper Session 2.
Abstract
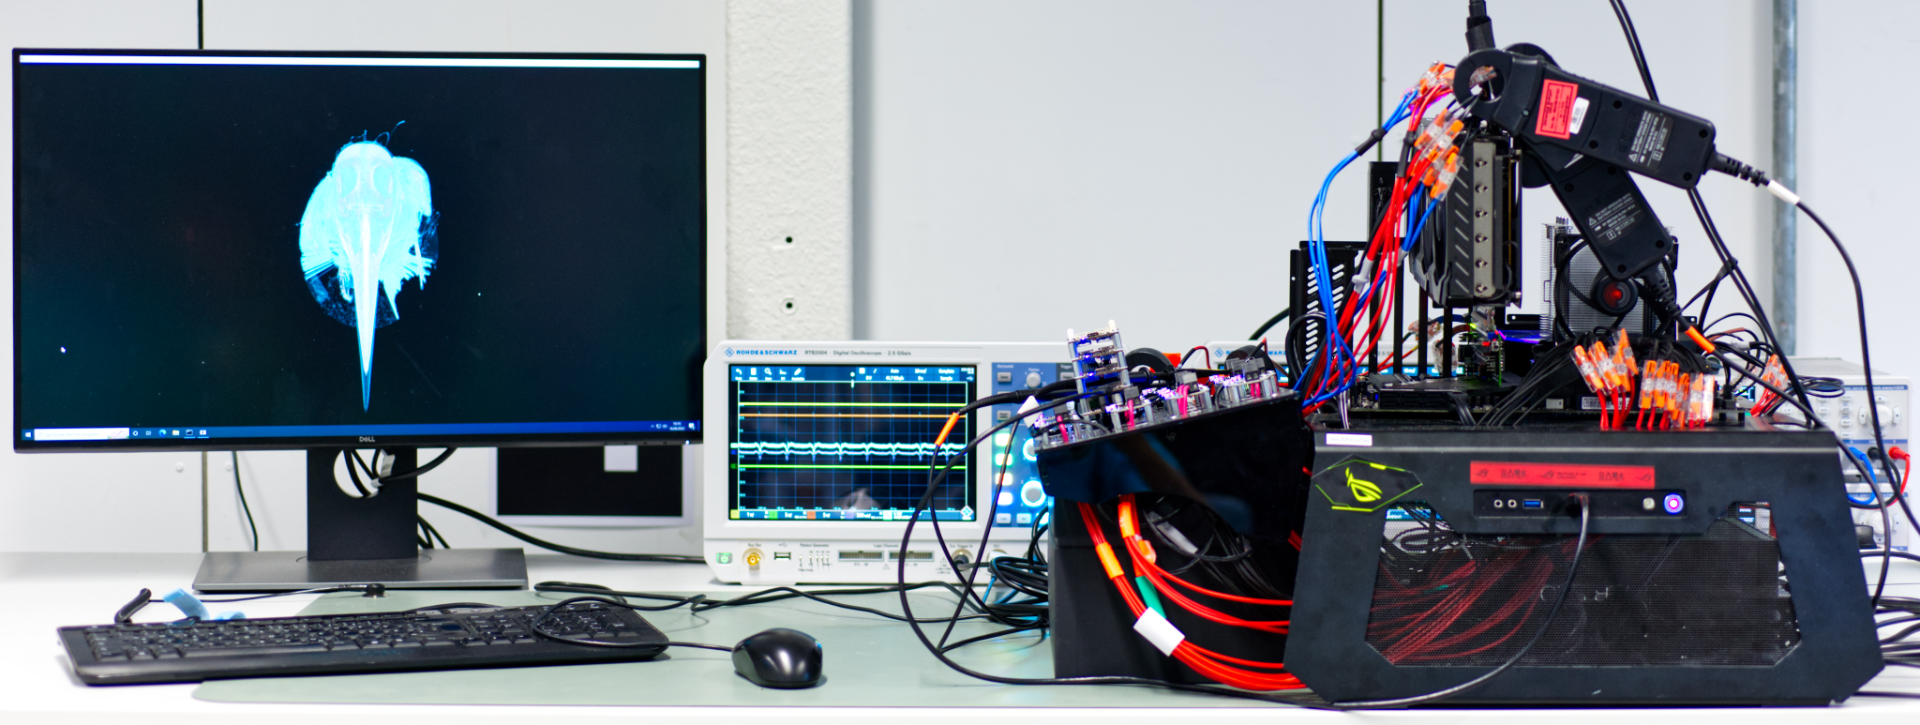
GPUs are the power-hungry tool of many visualisation researchers. However, their energy consumption has mostly been investigated outside the visualisation community, albeit our algorithms can generate more complex workloads than compute kernels. Additionally, a raising number of web-based visualisations potentially makes consumers other than the GPU more relevant. We present measurement setups for quantifying the energy cost of visualisation, ranging from software sensors over external power meters and micro controller-based setups to using oscilloscopes. These setups cover energy consumption of GPUs, CPUs and other components of a computing system. Using raycasting of spherical glyphs, volume rendering and D3 visualisations as examples, we show that there are viable options for evaluating most kinds of visualisations. We conclude by stating the challenges to a broader application of these techniques and by making recommendations on how to overcome these.