Visual Exploration of Rheological Test Results from Soft Materials (Q+A)

Jonas Madsen, Lasse Sode, Julie Frost Dahl, Milena Corredig, Hans-Jörg Schulz

View presentation:2022-10-17T14:35:00ZGMT-0600Change your timezone on the schedule page
2022-10-17T14:35:00Z
Exemplar figure, described by caption below
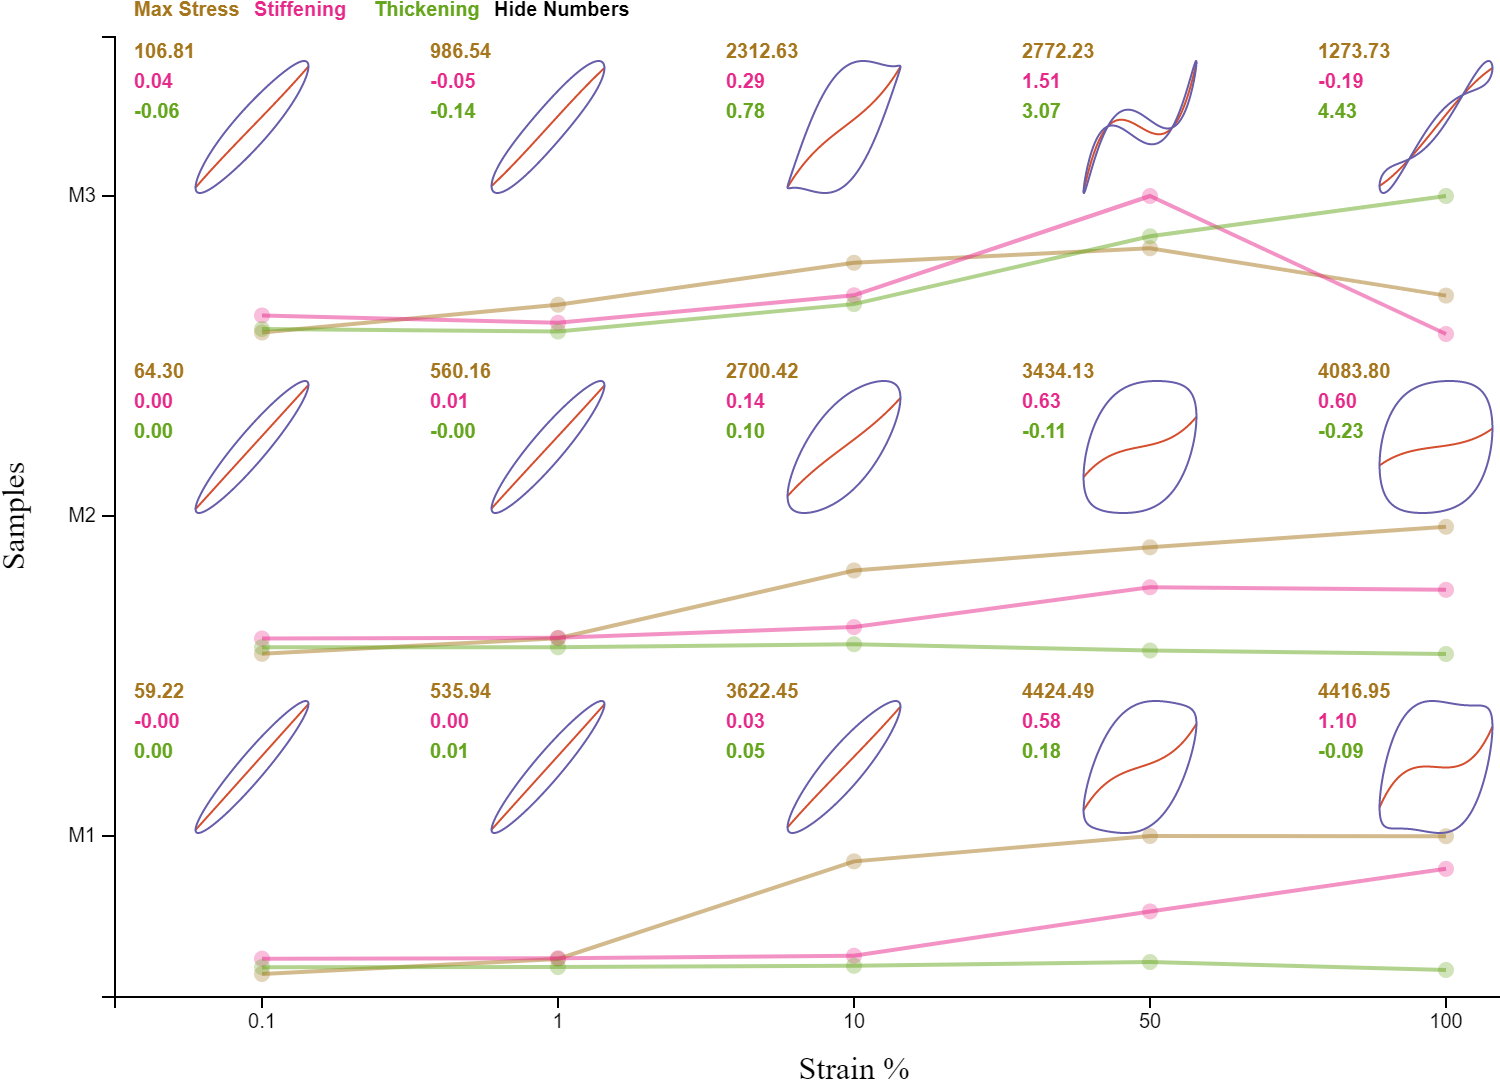
This Pipkin plot shows the viscoelastic behavior of a material under study across three samples and for different strain rates. The stress for each rheological test condition is shown as a Lissajous curve (blue) in the elastic perspective. This means the "slimmer" the Lissajous curves are, the more elastic the material behaves. And the "bulkier" the Lissajous curves become, the less elastic contribution can be observed in the viscoelastic material response. The VAOS visualization software combines this plot with a number of others to support the comparative visual analysis of rheological material properties.

The live footage of the talk, including the Q&A, can be viewed on the session page, TestVis: Session 1.

Abstract