ClassMat: a Matrix of Small Multiples to Analyze the Topology of Multiclass Multidimensional Data
Michael Aupetit, Ahmed Ali, Abdelkader Baggag, Halima Bensmail
View presentation:2022-10-17T21:20:00ZGMT-0600Change your timezone on the schedule page
2022-10-17T21:20:00Z
The live footage of the talk, including the Q&A, can be viewed on the session page, TopoInVis: Session 2, Early Career Lightning Talks + Best Paper Awards .
Keywords
Visualization; topological data analysis;
Abstract
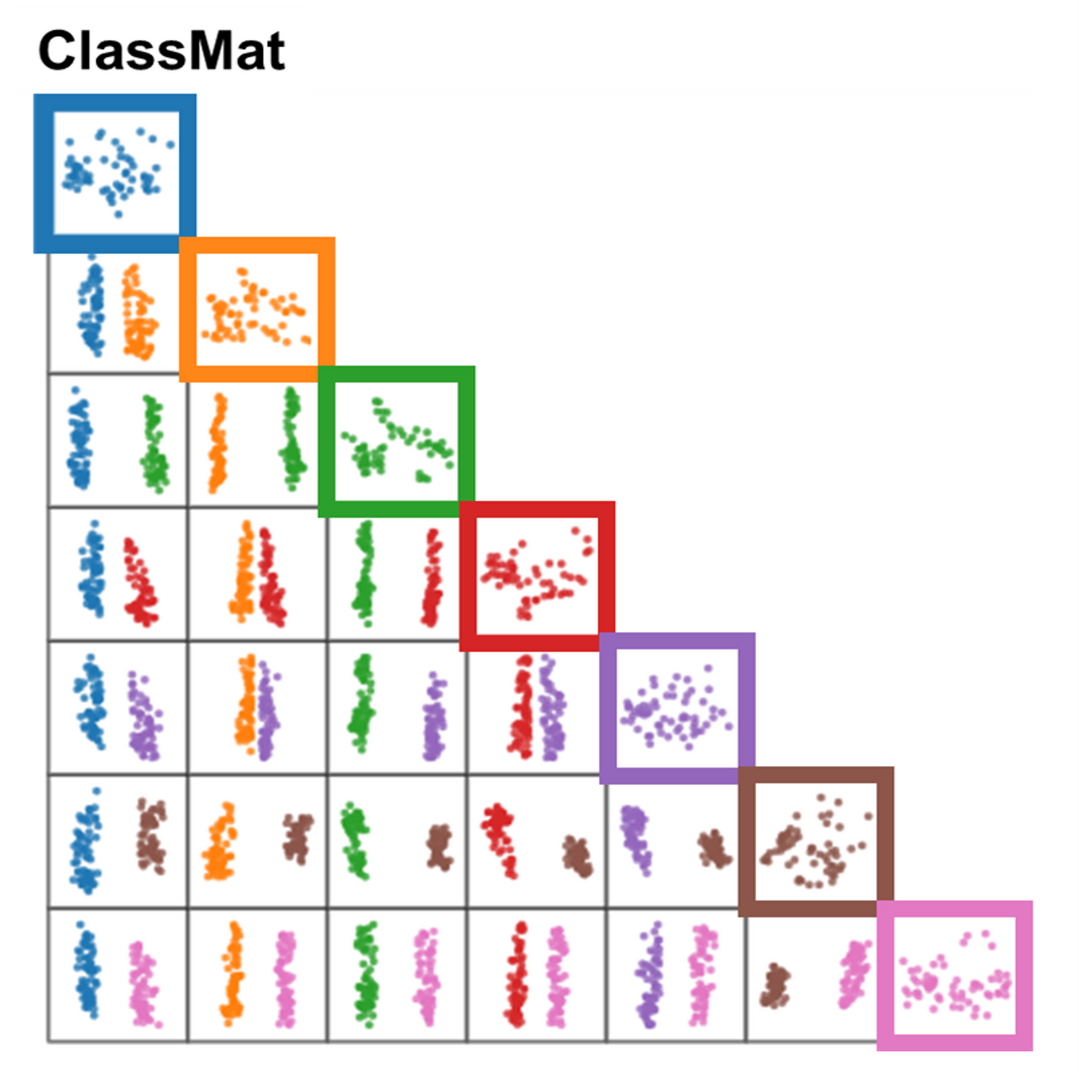
Data scientists often deal with multiclass multidimensional data. There is a need to support the exploration of such data with topological methods. We propose a new visualization metaphor for multiclass data and illustrate it with two complementary analytic approaches. We design ClassMat, a visualization matrix similar in spirit to the scatterplot matrix (SPLOM or pairs plot) but focused on pairs of classes rather than pairs of dimensions. We show how this visualization matrix can be used in two main multidimensional data visualization pipelines: visualization-then-topological-analysis and topological-analysis-then-visualization. In particular, we show it can support the analyst in detecting interferences between topological features of different classes.