A Qualitative Evaluation and Taxonomy of Student Annotations on Bar Charts

Md Dilshadur Rahman, Ghulam Jilani Quadri, Paul Rosen

View presentation:2022-10-17T14:53:00ZGMT-0600Change your timezone on the schedule page
2022-10-17T14:53:00Z
Exemplar figure, described by caption below
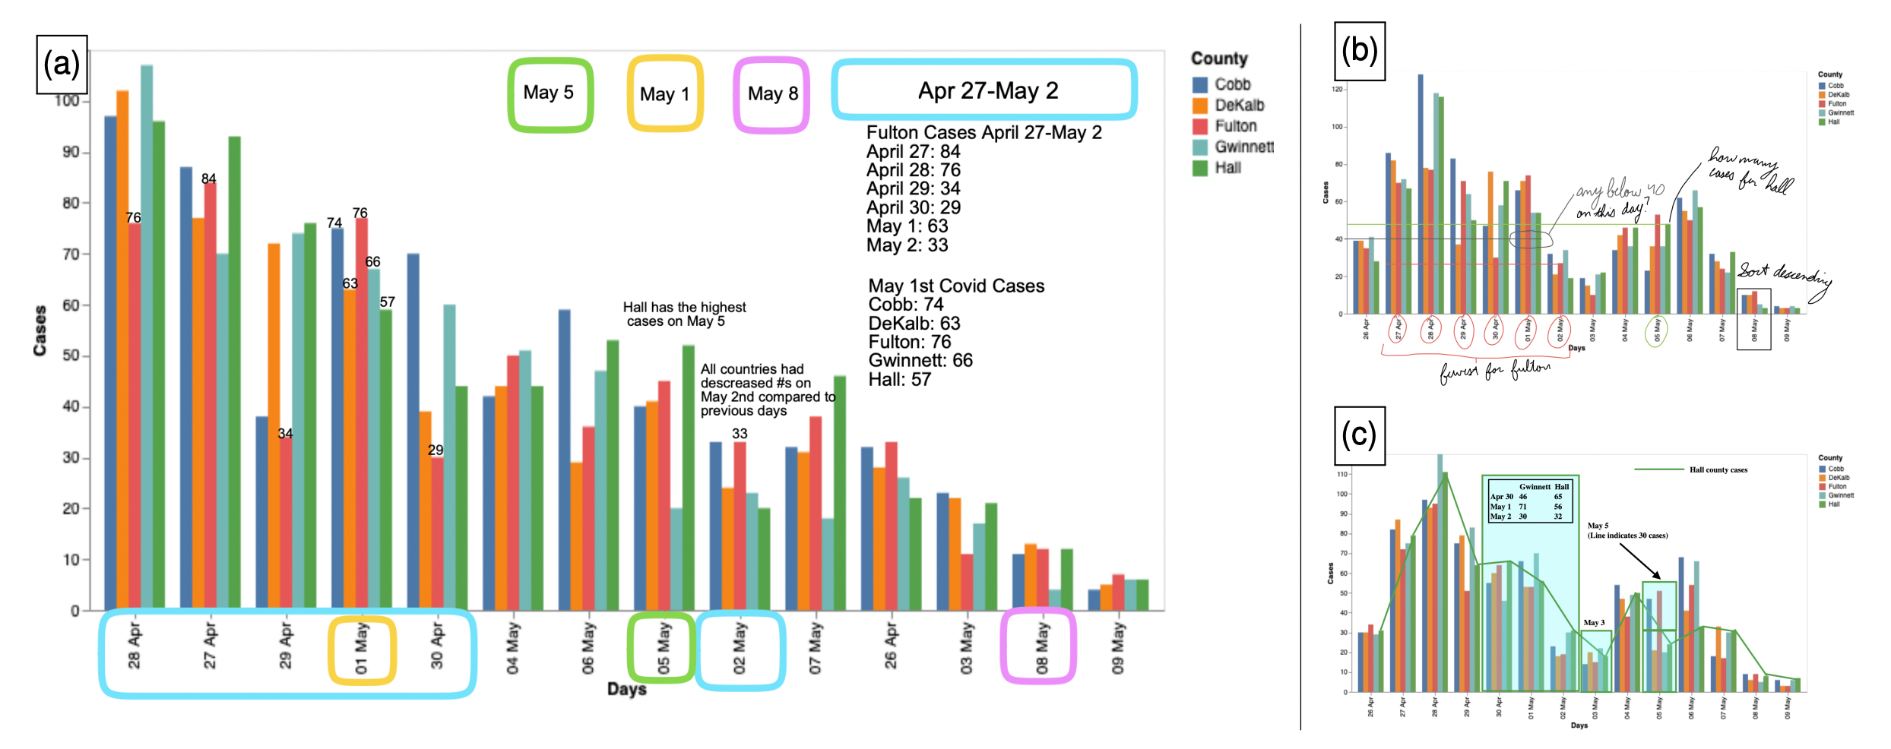
Three examples of annotated bar chart submissions. (a) One student used rectangles for filtering, text on bars for retrieving values and pointing out the extrema, and a legend for filtering important dates. (b) A second student annotated the chart with ellipses, rectangles, and lines for filtering, and text for filtering and as an identifier. (c) A final student used rectangular shapes and highlights for filtering, texts as an identifier, a trend line for finding extrema, and a legend for filtering.

The live footage of the talk, including the Q&A, can be viewed on the session page, VisComm: Opening, Presentations, and Late Breaking Work.

Abstract