How should we design violin plots?

Pere-Pau Vázquez, Laia Viale Herrando, Elena Molina Lopez

View presentation:2022-10-17T19:35:00ZGMT-0600Change your timezone on the schedule page
2022-10-17T19:35:00Z
Exemplar figure, described by caption below
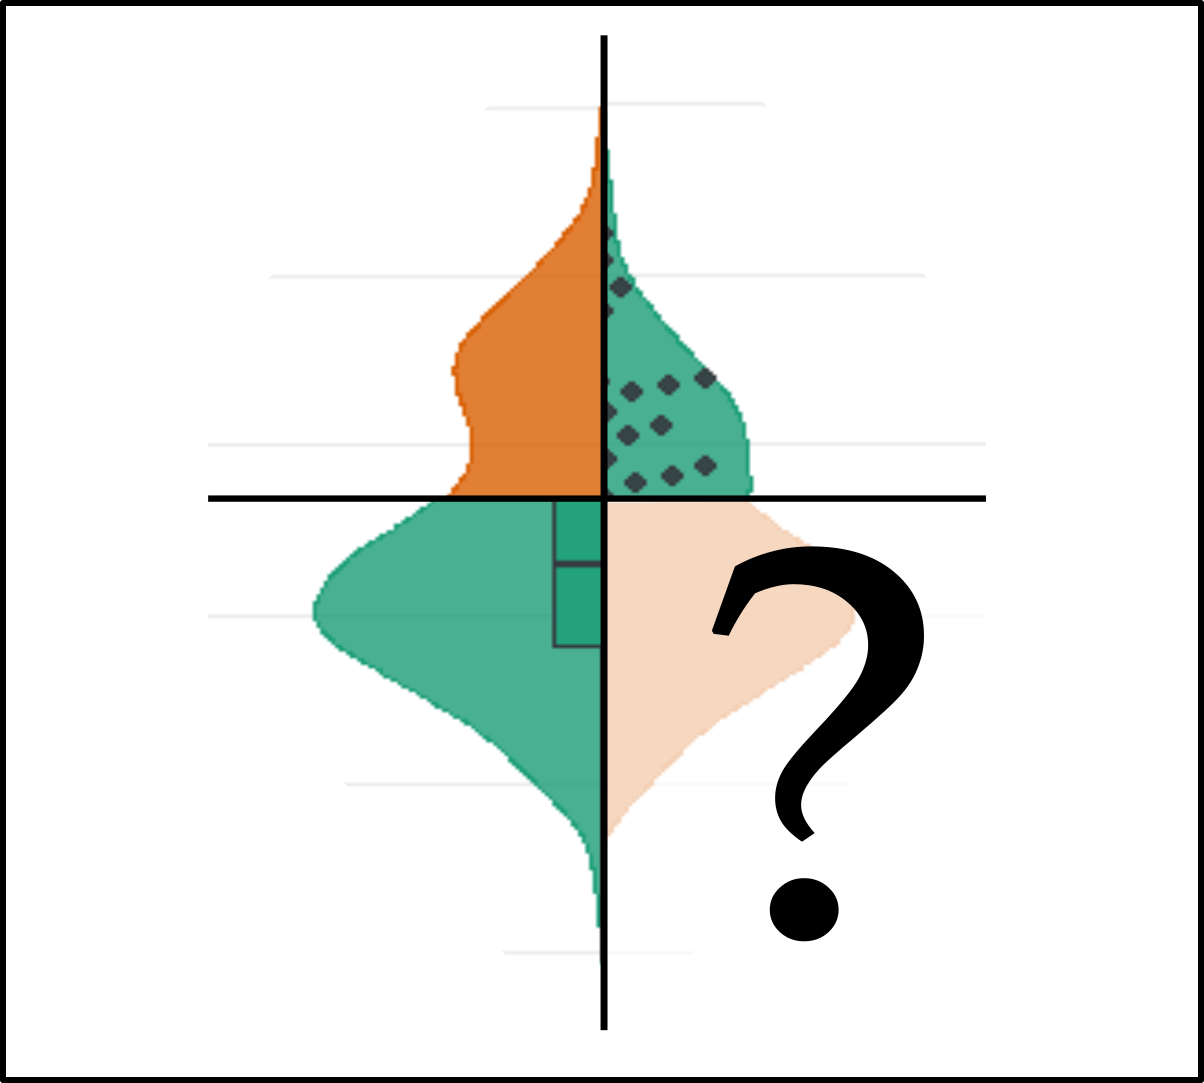
Violin plots are an extension of the boxplot design with a “density trace” as a line. Their goal is to analyze distributions when individual data is less important. Sometimes they are combined with other representations such as boxplots or beeswarms. However, users have difficulty comparing distributions, and the usefulness of these combinations has not been tested. Therefore, we have carried out an experiment to clarify how the different configurations affect judgments over values encoded. Our aim is to extract advice for the best design of these graphics.

The live footage of the talk, including the Q&A, can be viewed on the session page, VisGuides: Session 1.

Abstract