VisQuiz: Exploring Feedback Mechanisms to Improve Graphical Perception
Ryan Birchfield, Maddison Caten, Errica Cheng, Madyson Kelly, Truman Larson, Hoang Phan Pham, Yiren Ding, Noëlle Rakotondravony, Lane Harrison
View presentation:2022-10-20T14:18:00ZGMT-0600Change your timezone on the schedule page
2022-10-20T14:18:00Z
Prerecorded Talk
The live footage of the talk, including the Q&A, can be viewed on the session page, Personal Visualization, Theory, Evaluation, and eXtended Reality.
Fast forward
Keywords
Visualization, Graphical Perception, Feedback
Abstract
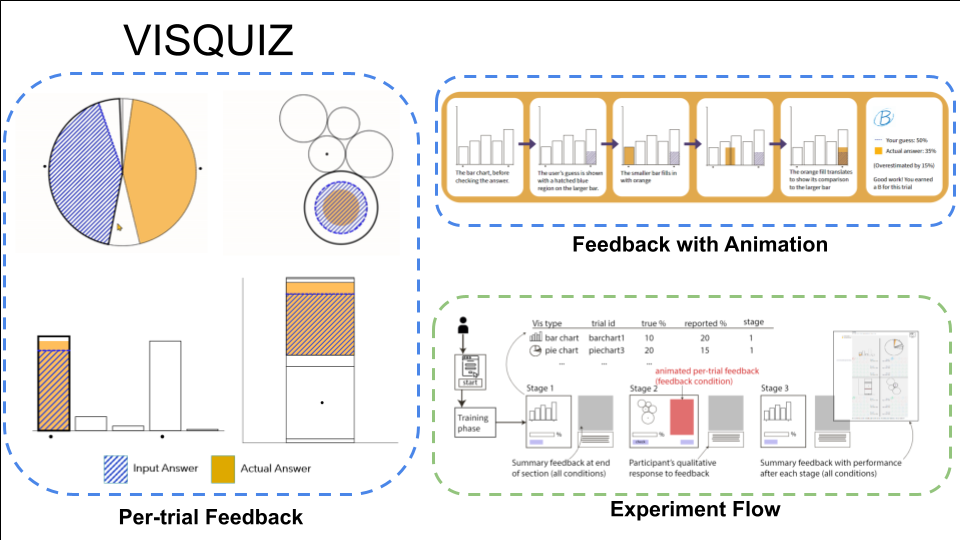
Graphical perception studies are a key element of visualization research, forming the basis of design recommendations and contributing to our understanding of how people make sense of visualizations. However, graphical perception studies typically include only brief training sessions, and the impact of longer and more in-depth feedback remains unclear. In this paper, we explore the design and evaluation of feedback for graphical perception tasks, called VisQuiz. Using a quiz-like metaphor, we design feedback for a typical visualization comparison experiment, showing participants their answer alongside the correct answer in an animated sequence in each trial. We extend this quiz metaphor to include summary feedback after each stage of the experiment, providing additional moments for participants to reflect on their performance. To evaluate VisQuiz, we conduct a between-subjects experiment, including three stages of 40 trials each with a control condition that included only summary feedback. Results from n = 80 participants show that once participants started receiving trial feedback (Stage 2) they performed significantly better with bubble charts than those in the control condition. This effect carried over when feedback was removed (Stage 3). Results also suggest an overall trend of improved performance due to feedback. We discuss these findings in the context of other visualization literacy efforts, and possible future work at the intersection of visualization, feedback, and learning. Experiment data and analysis scripts are available at the following repository https://osf.io/jys5d/